
The number of property sales in a region this year is expected to be 9 more than the number of property sales in the region last year. The function H(x) represents the number of property sales this year, where x represents the number of properties sold last year.
Which notation represents the number of property sales this year, given that the number of properties sold last year was 140?
As regulations change, the number of licensed sellers of a product decreases. The graph models the change in the number of licensed sellers over time.
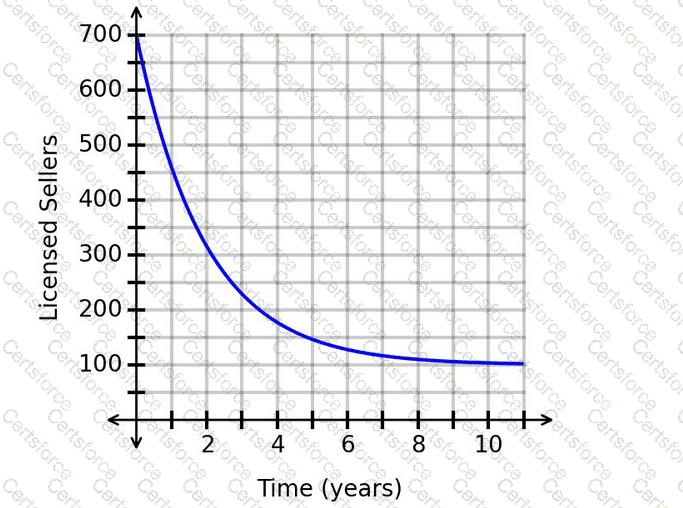
What does the horizontal asymptote mean?
A recipe calls for a constant ratio of water and lemon juice. The graph shows the relationship between the amounts of these two ingredients, where wis the volume of water and lis the volume of lemon juice.
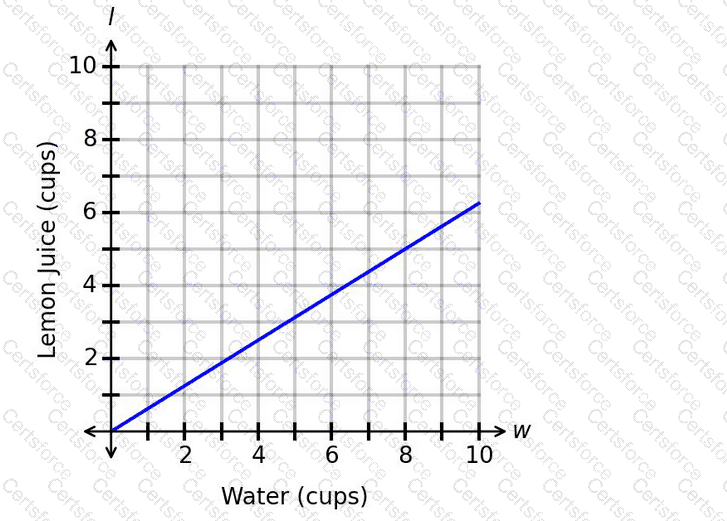
What is the correct interpretation of the rate of change?
The function P(t) represents the yearly profit, in millions of dollars, for a clothing store since opening. The graph of P(t) is shown.
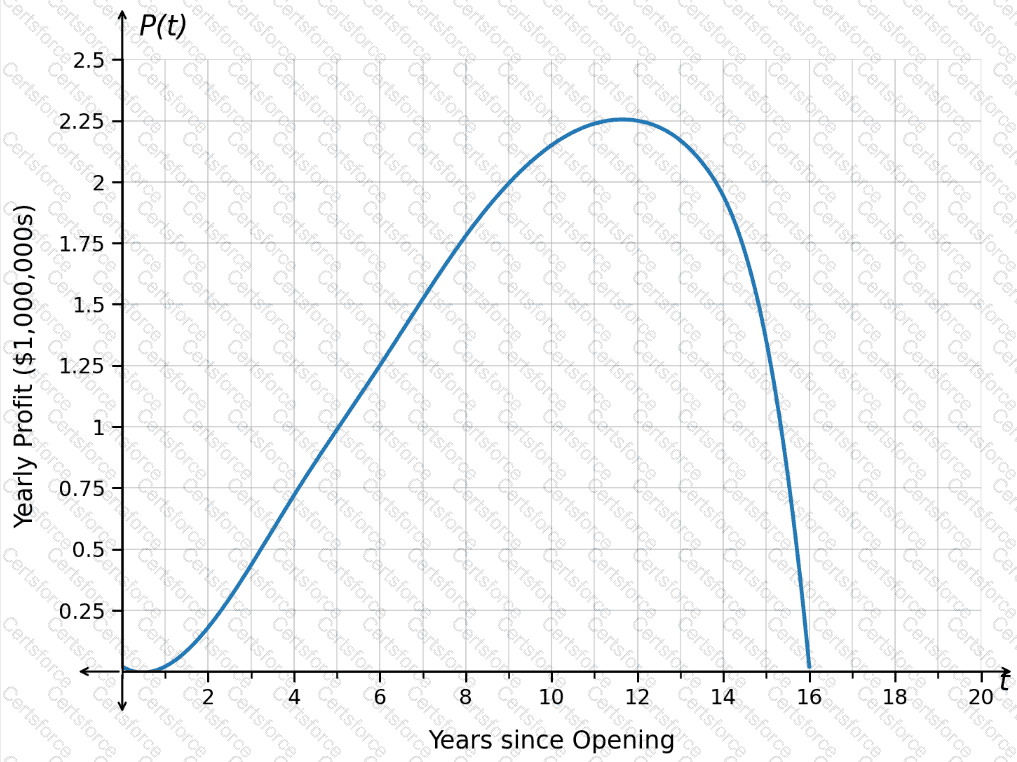
How should the maximum value be interpreted?
Based on collected data, the value of a painting can be modeled using the exponential function f(x)=240(1.12)
x
. In this case, x represents the number of years since 2005, and f(x) represents the value of the painting in dollars.
Which value represents the average yearly rate of change of the painting’s value from 2013 to 2015?
The graph shows the daily practice duration for a musician, where the number of days since the beginning of the month is along the horizontal axis and the number of minutes practiced per day is along the vertical axis.
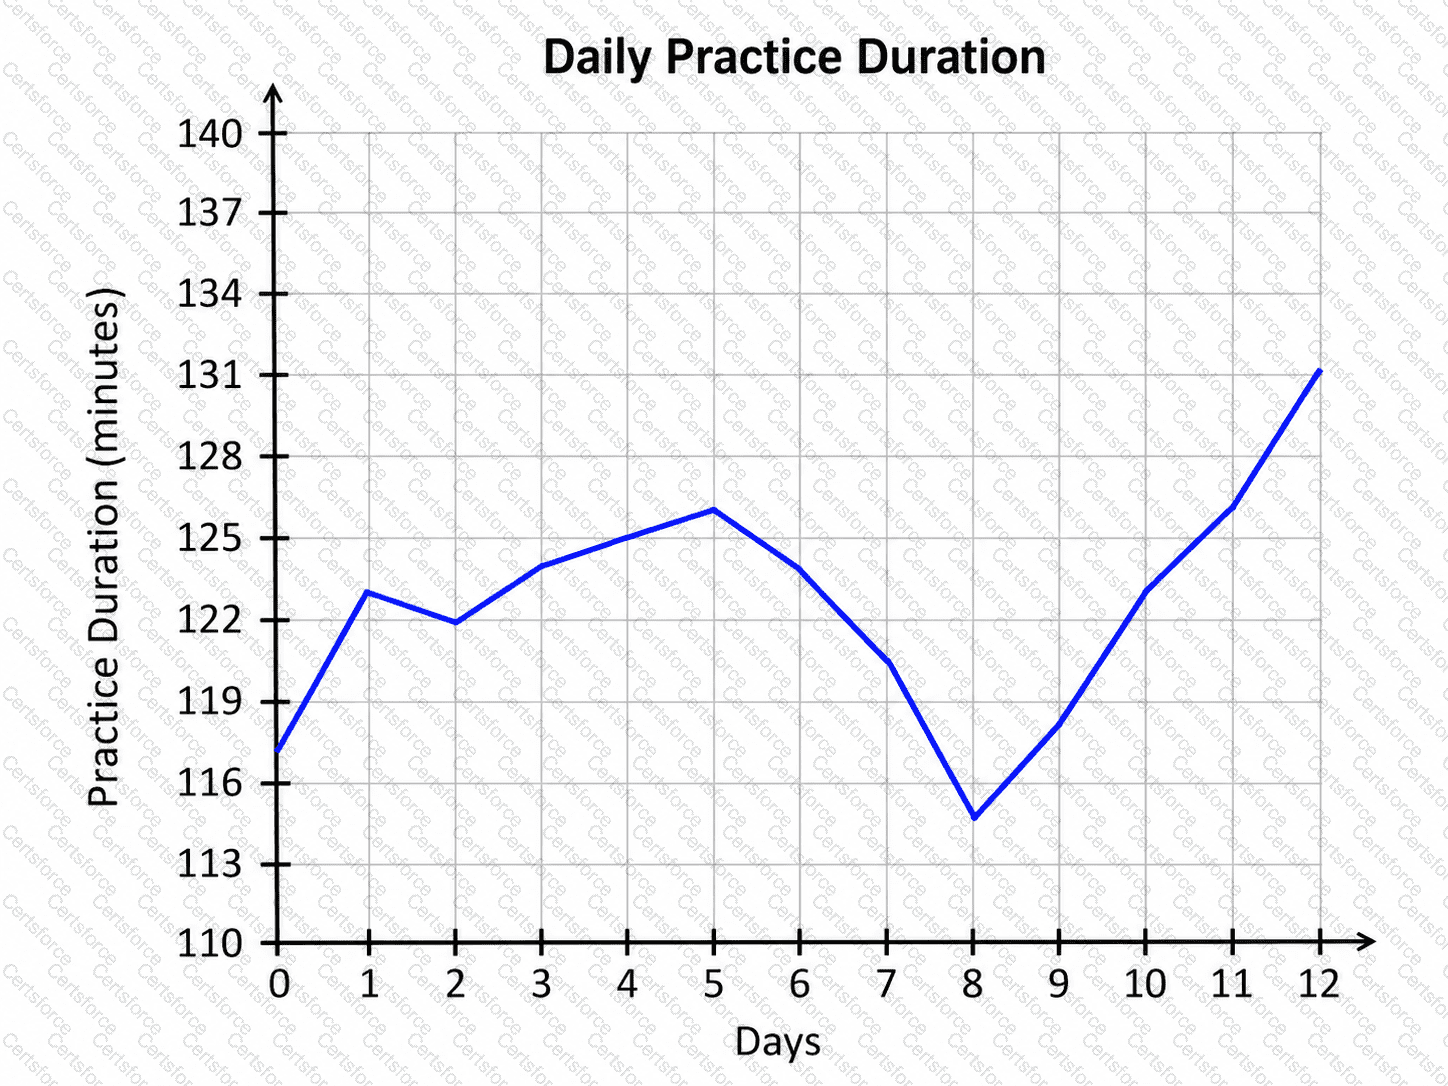
Based on the graph, what was the practice duration for day 8?
As a drone travels away from an operator, the function G(x)=24+47x models the distance, in yards, between the drone and the operator at x minutes. What is the value of G(1.9)?
A researcher collected data on the number of large donations per year to a charitable organization. The results are shown in the scatterplot. A regression function is graphed with r^2.
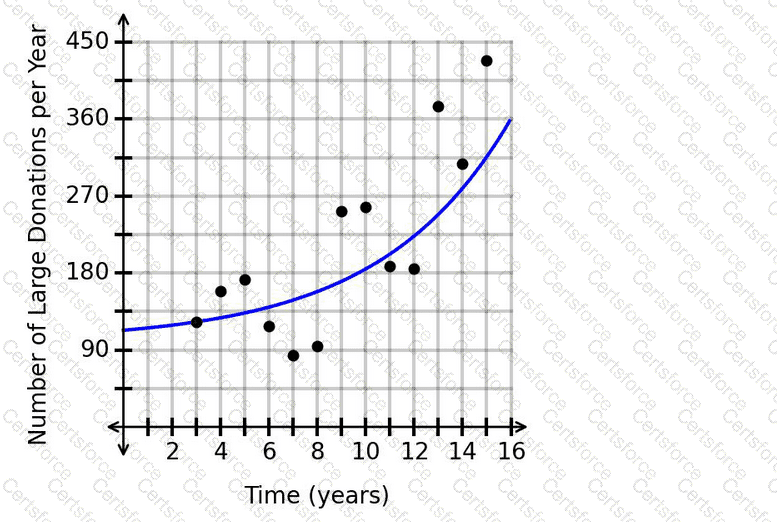
What is the appropriate range of x-values for extrapolation?
The number of tasks completed by computer B is 12 more than the number of tasks completed by computer A. Let F(x)represent the relationship between the number of tasks completed by the two computers, where xis the number of tasks completed by computer A and Fis the number of tasks completed by computer B.
Which function represents this situation?
The data in the scatterplot represents the number of people working at a research station over time. The graphed regression function has an r
2
value of 0.96. The predicted number of people working at the research station after 18.1 years is 541.
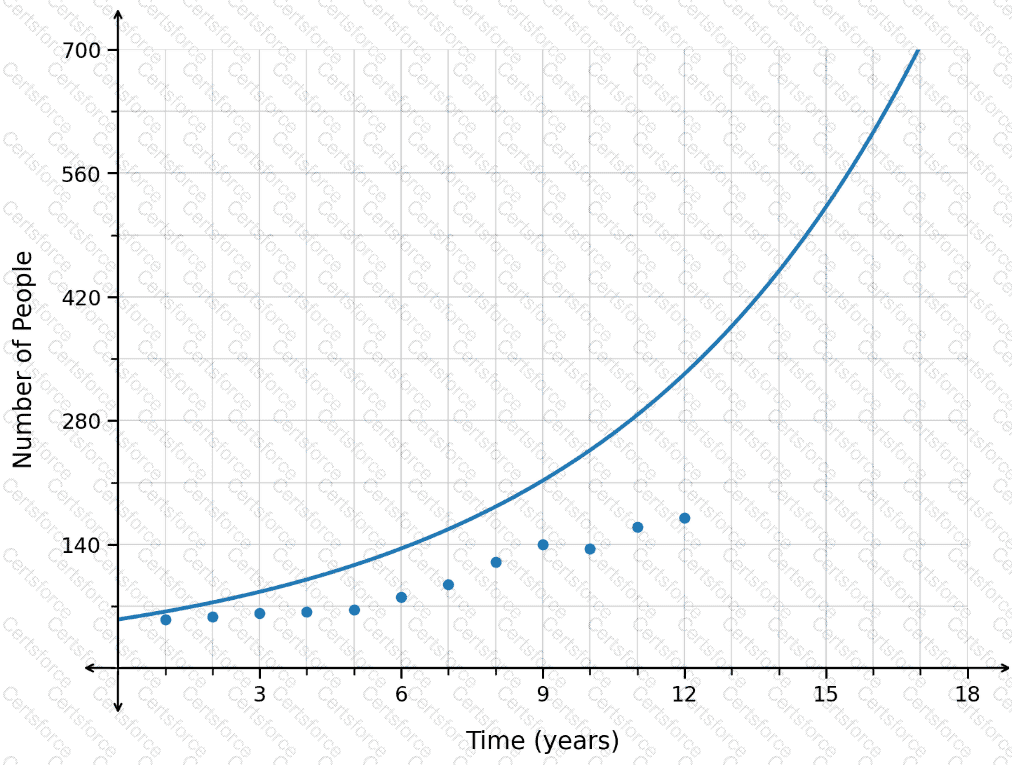
Is this prediction appropriate?
