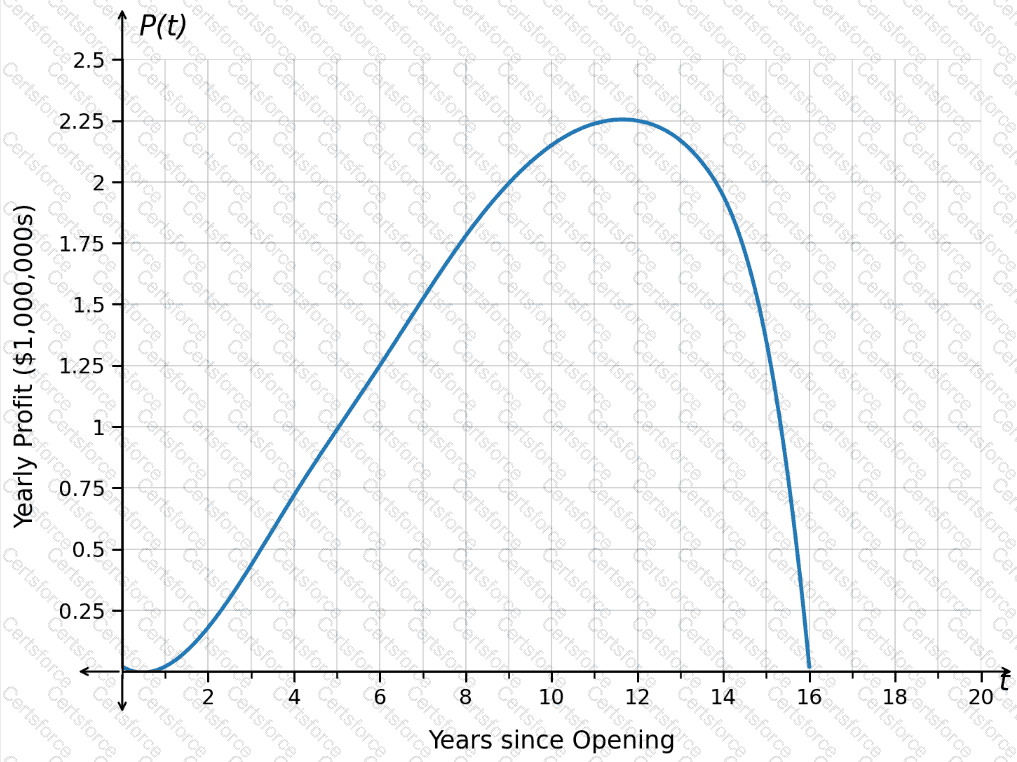
The maximum value of a polynomial graph is found at the highest point of the curve. In this problem, P(t) represents yearly profit in millions of dollars, and t represents years since opening. The graph reaches its highest point at approximately t=10.5, so the maximum yearly profit occurs about 10.5 years after opening. The vertical value at that point is about 2.25, but because the profit is measured in millions of dollars, this means 2.25 million dollars. Converting gives 2.25×1,000,000=2,250,000. Therefore, the correct interpretation must include both the correct time and the correct dollar amount. The correct answer is C.
Contribute your Thoughts:
Chosen Answer:
This is a voting comment (?). You can switch to a simple comment. It is better to Upvote an existing comment if you don't have anything to add.


Submit