
A company provides internet service to approximately 1,050 customers each year. The table shows the percentage of customers with fiber internet each year since 2020.
Years since 2020 Percent of Customers with Fiber
0 19
1 28
2 40
3 57
What was the approximate number of customers with fiber internet in 2023?
A new company just launched and is using the function M(t)to predict its market share after tyears. The graph of M(t)is shown.
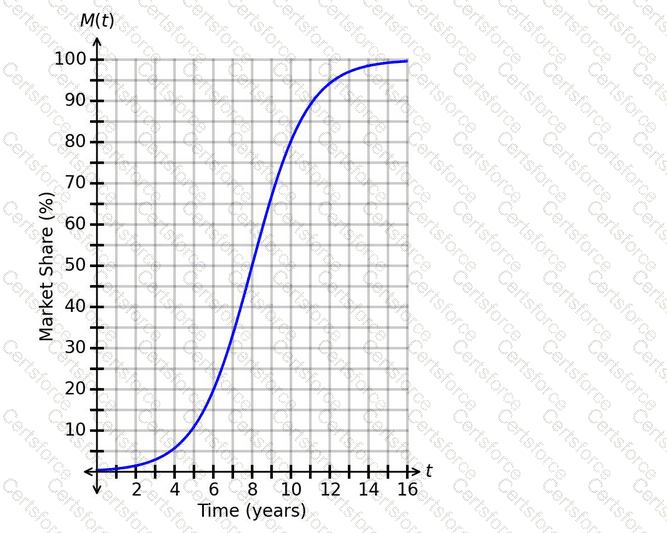
When should the company expect to have a market share of 40%?
As sacks are unloaded off a wagon, the total weight of the wagon and sacks changes. Each sack has the same weight. After 3 sacks are removed, the total weight of the cart and remaining sacks is 116 pounds. After 6 sacks are removed, the total weight is 101 pounds.
What is the weight of each sack?
The number of property sales in a region this year is expected to be 6 less than the number of property sales in the region last year. The function H(x)represents the number of property sales this year, where xrepresents the number of properties sold last year.
Which notation represents the number of property sales this year, given that the number of properties sold last year was 330?
The function N(t)models the number of subscribers to a virtual newsletter over time. The graph of N(t)is shown. The horizontal axis represents the number of years since the newsletter started, and the vertical axis represents the number of subscribers, in thousands.
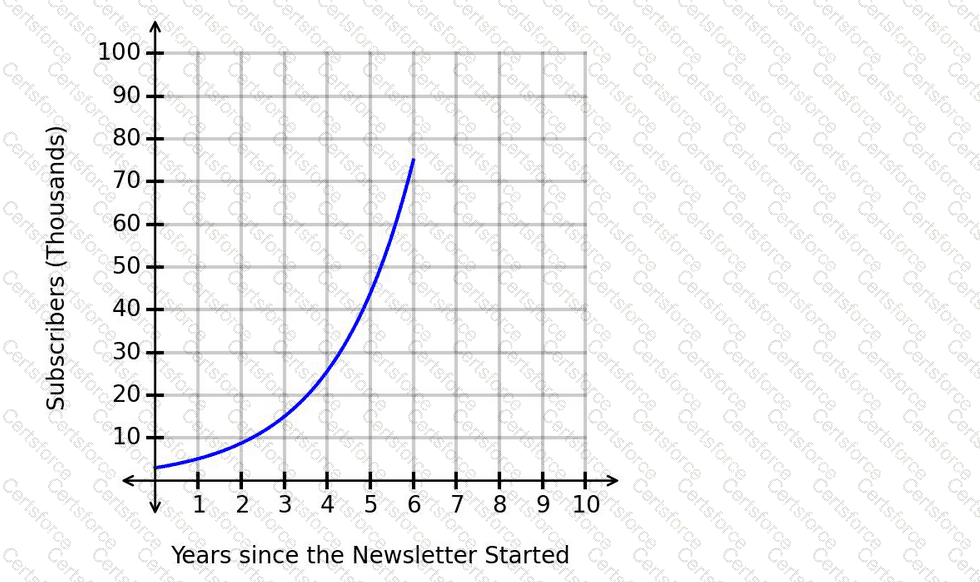
How is the number of subscribers changing over time based on the graph?
In the graph showing the number of daily homework problems assigned for a math class, the horizontal axis shows the number of school days since the beginning of the term and the vertical axis shows the number of daily homework problems.
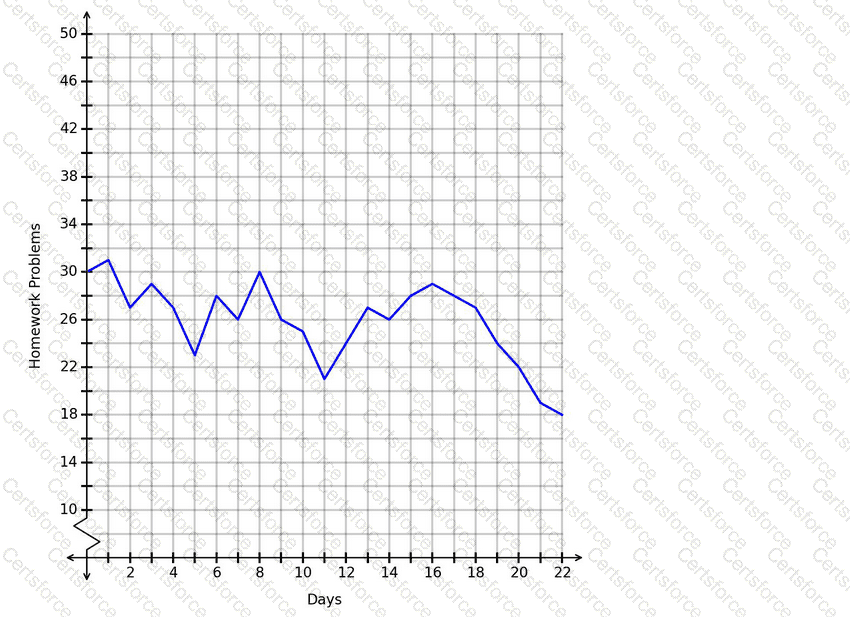
Which conclusion is correct based on this graph?
The function P(t)represents the daily profit, in hundreds of dollars, for a museum since opening. The graph of P(t)is shown.
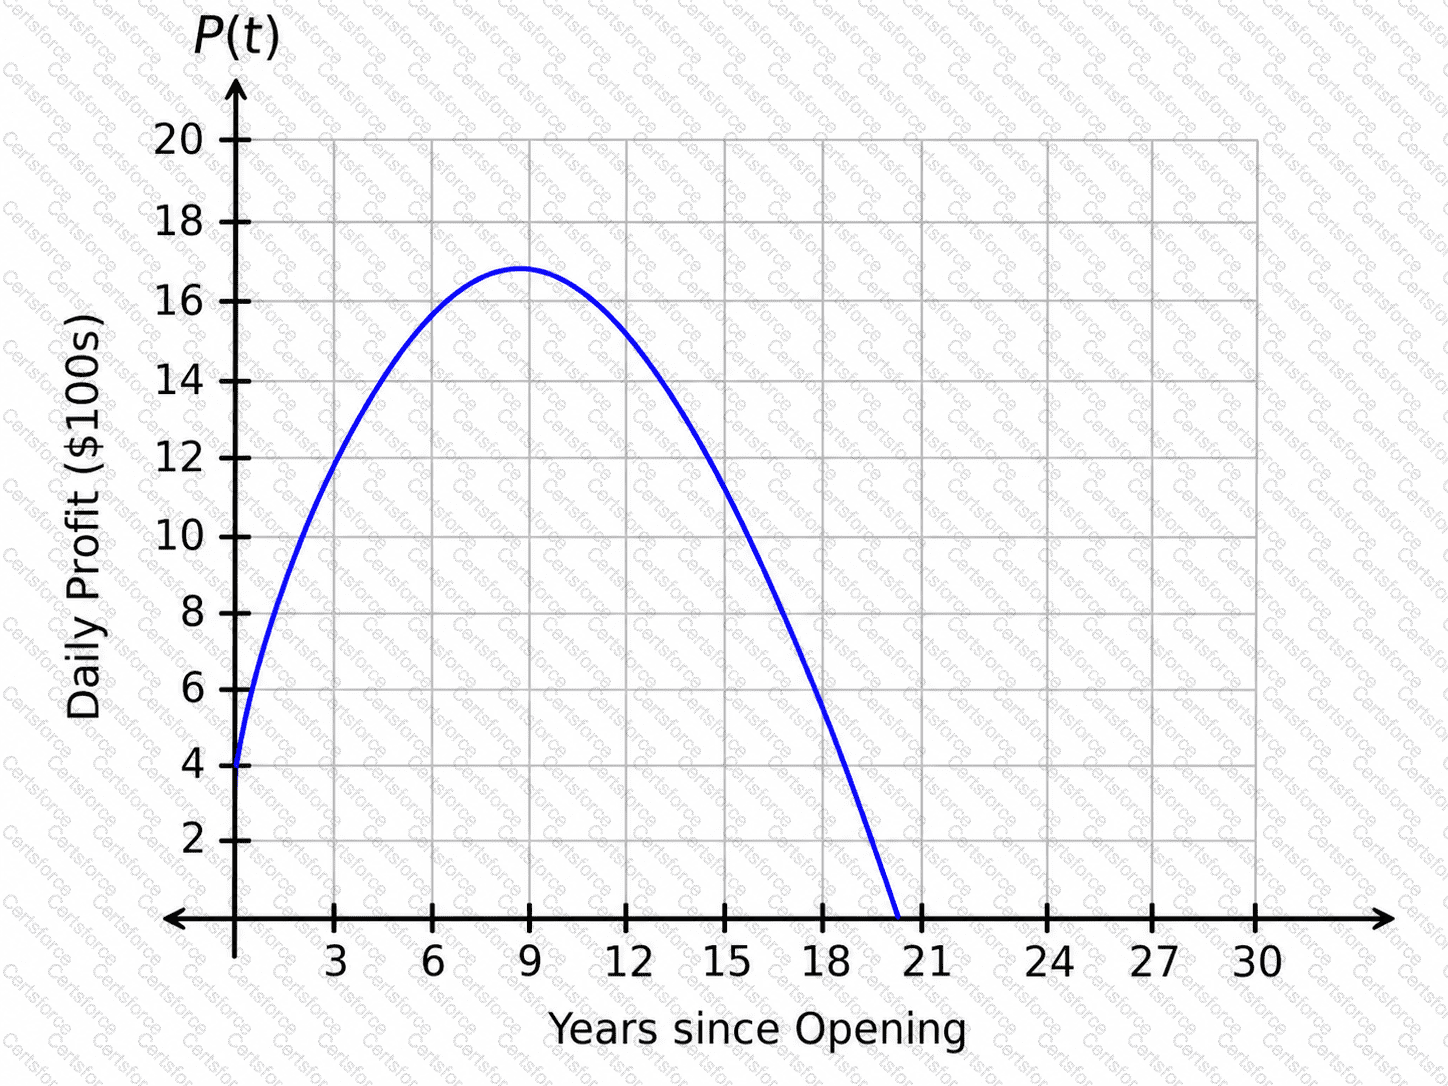
What is the correct interpretation of the maximum value?
The number of letters processed daily at a mail center is modeled by the decreasing exponential function shown in the graph.
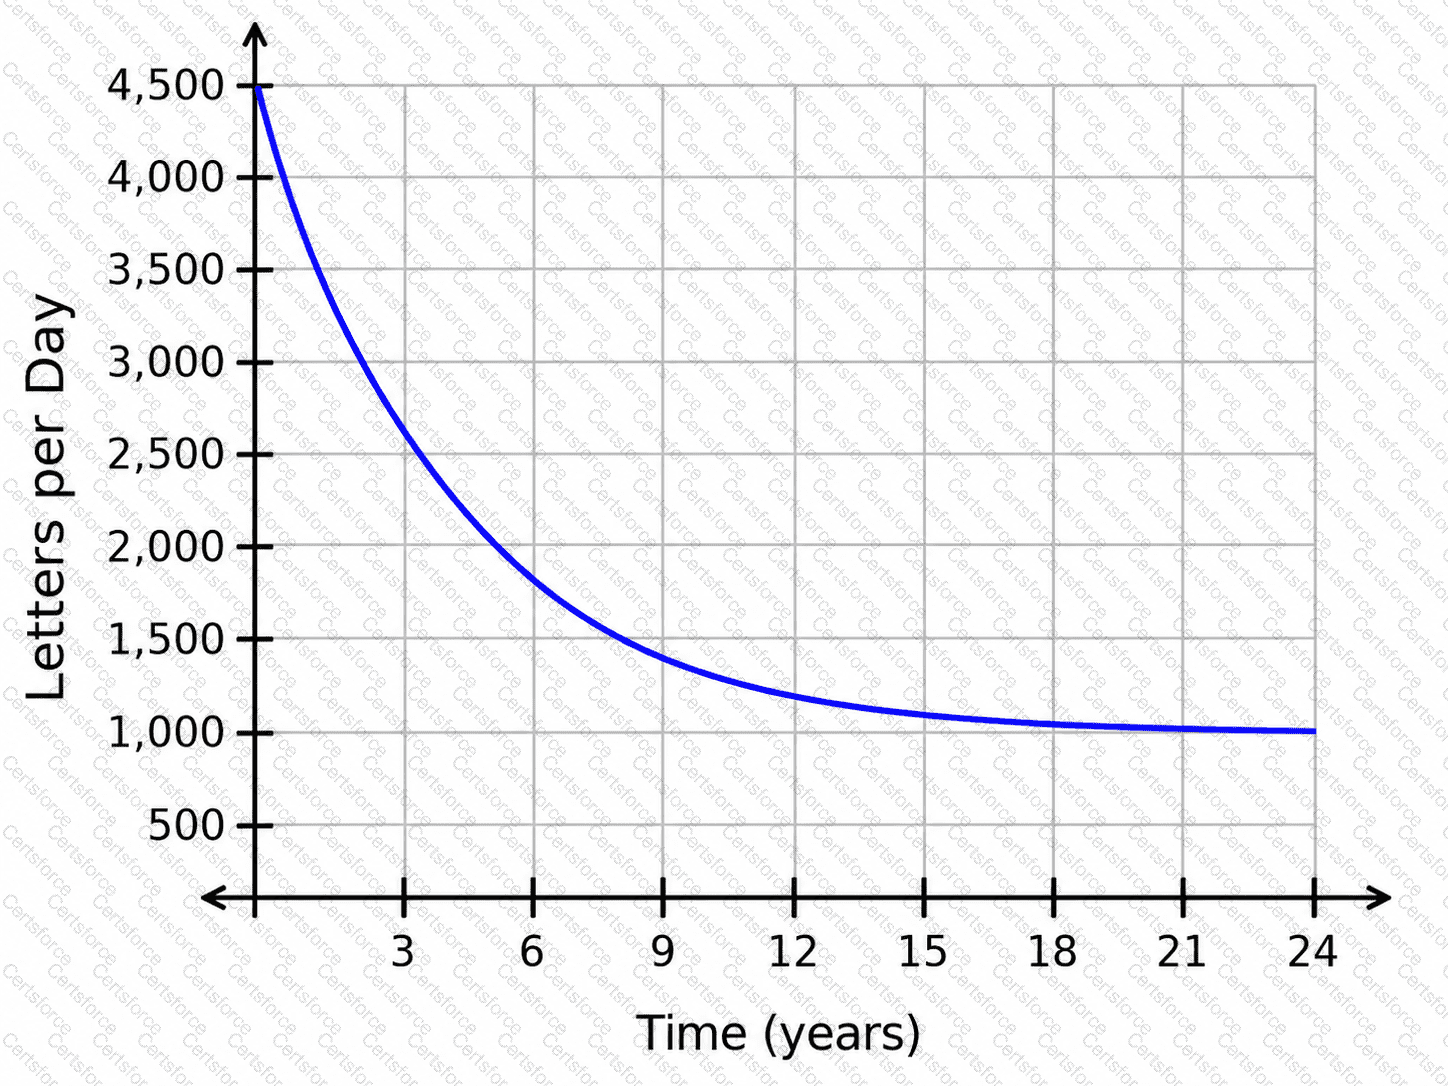
What is the long-term trend in the number of letters processed per day, based on the equation of the horizontal asymptote?
Which statement correctly interprets u(8), given that u(t)=0.21t
3
−4.09t
2
+18.89t+69.5 represents the number of units, u, in an inventory warehouse t hours after 9:00 a.m.?
A new company just launched and is using the function M(t)to predict its market share after tyears. The graph of M(t)is shown.
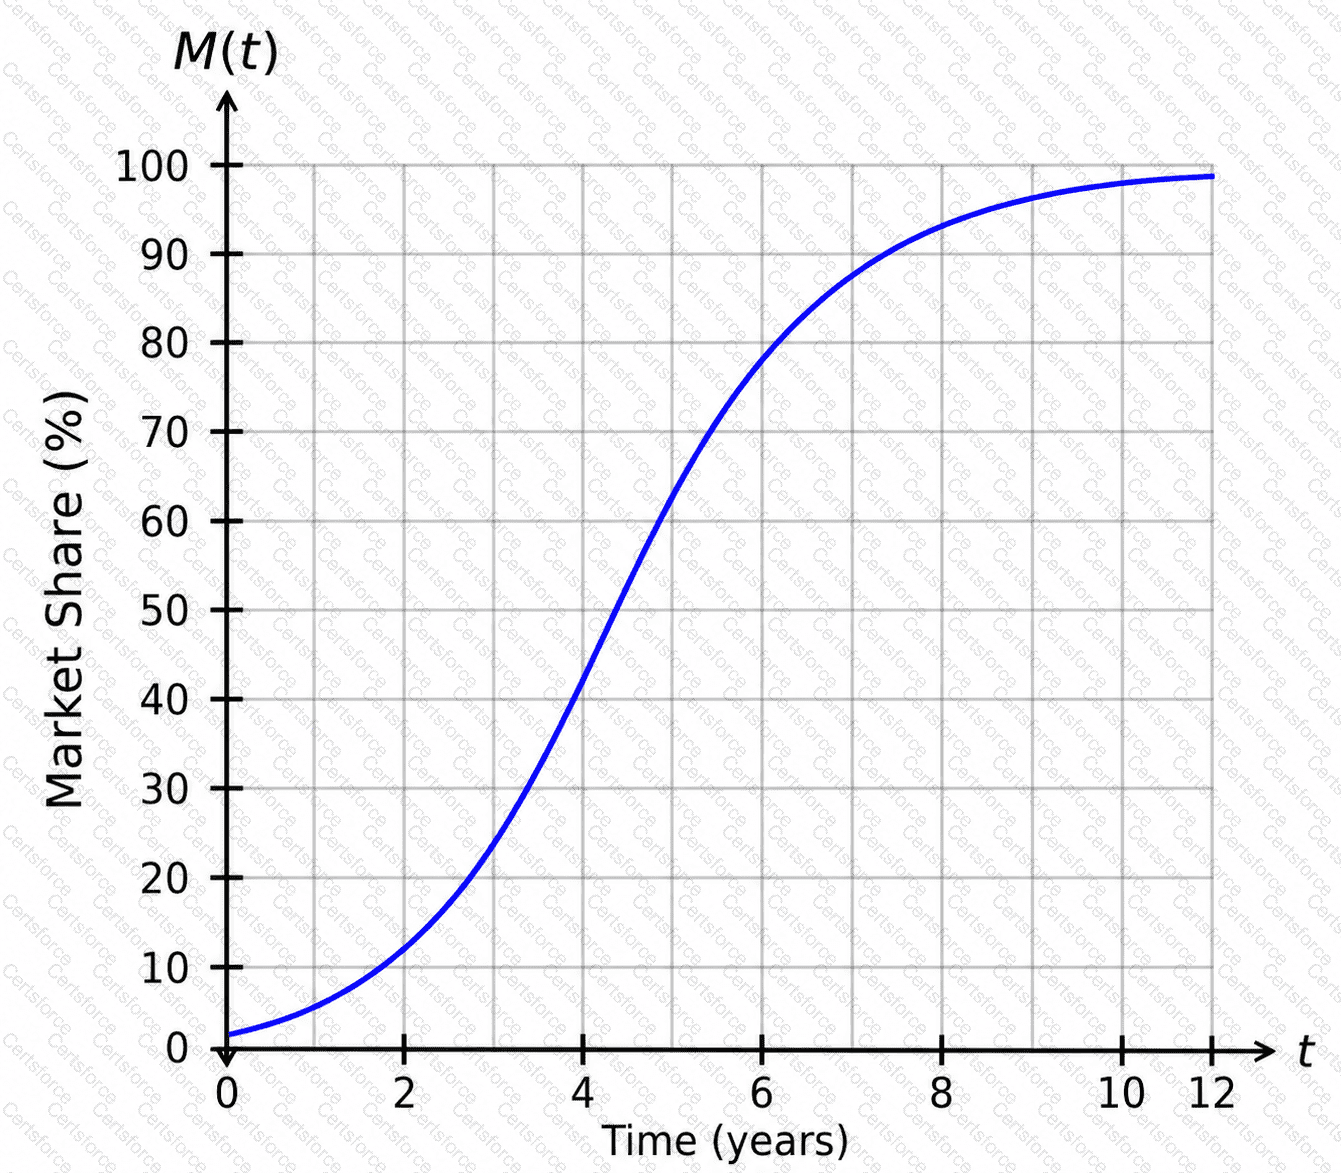
When should the company expect to have a market share of 60%?
