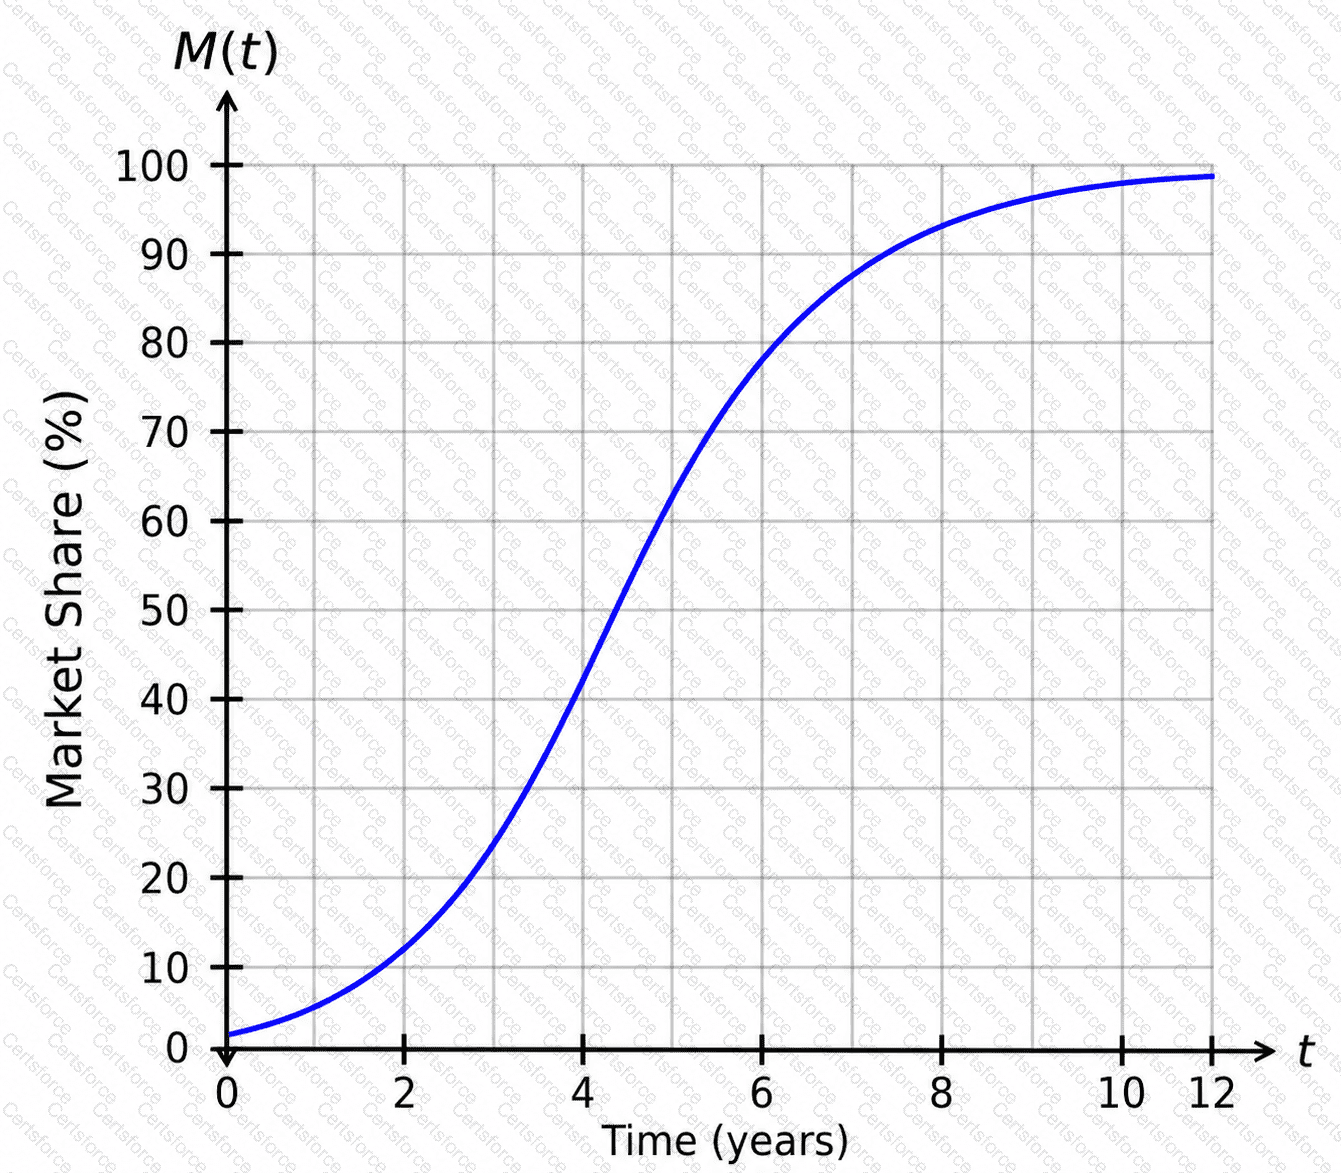
The function M(t)represents the company’s predicted market share after tyears.
The horizontal axis represents:
t= " time in years "
The vertical axis represents:
M(t)= " market share percentage "
We need to find when the company’s market share reaches:
60%
To answer this from the graph:
Locate 60on the vertical axis.
Move horizontally until reaching the blue curve.
Move downward to the horizontal axis to read the corresponding time.
From the graph, the blue curve reaches 60%a little after 6years, approximately at:
t=6.6
So the company should expect to have a market share of 60%after about:
6.6 " years "
Contribute your Thoughts:
Chosen Answer:
This is a voting comment (?). You can switch to a simple comment. It is better to Upvote an existing comment if you don't have anything to add.


Submit