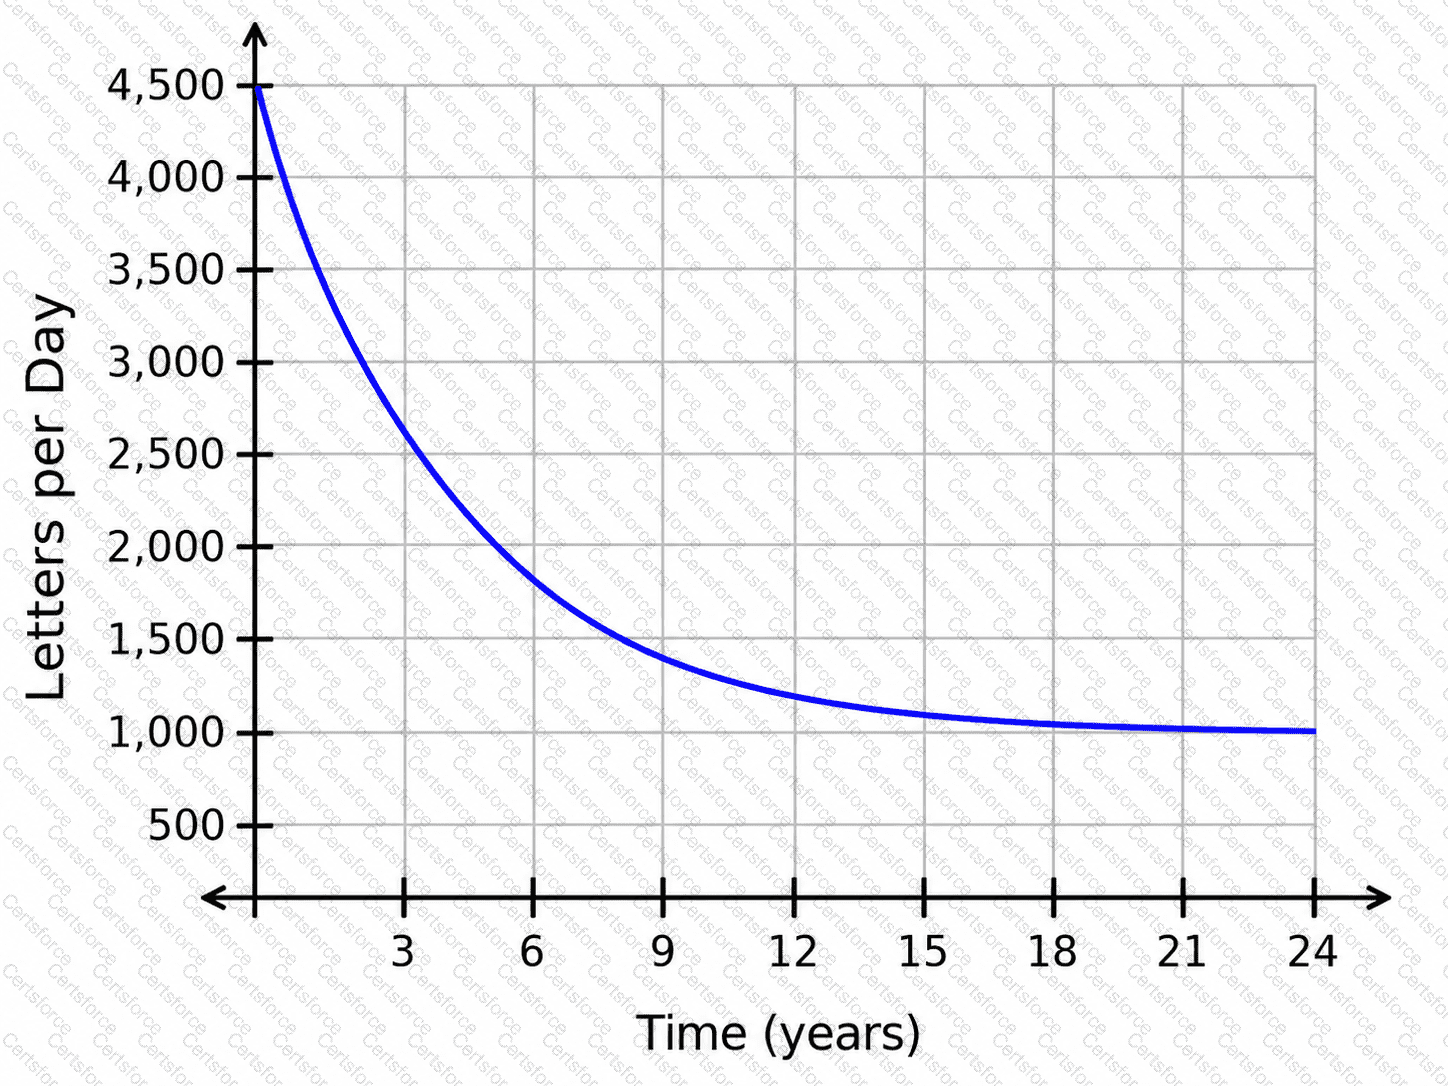
The graph shows a decreasing exponential function.
In Applied Algebra, a decreasing exponential function may approach a fixed value over time. This fixed value is called the horizontal asymptote.
The horizontal asymptote represents the long-term value that the function gets closer and closer to, but does not necessarily cross or reach exactly.
From the graph, the curve decreases quickly at first, then begins to level off near:
y=1,000
This means that as time continues, the number of letters processed per day approaches:
1,000
So the long-term trend is that the mail center will process about:
1,000 " letters per day "
Contribute your Thoughts:
Chosen Answer:
This is a voting comment (?). You can switch to a simple comment. It is better to Upvote an existing comment if you don't have anything to add.


Submit