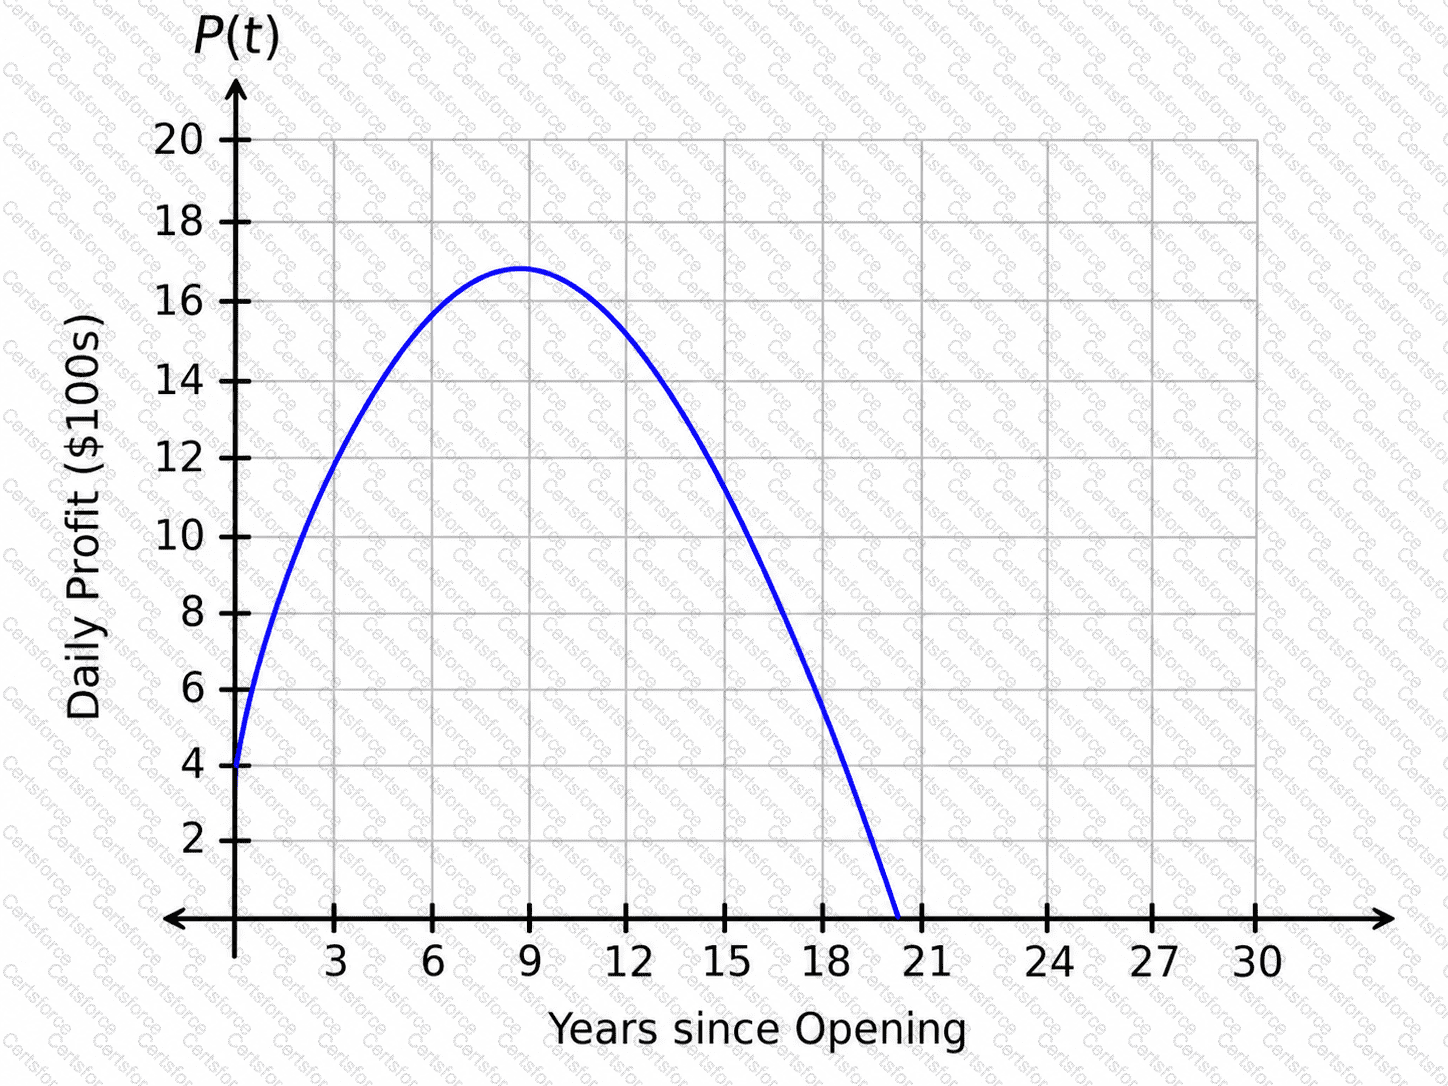
The graph shows a curved, downward-opening function. This type of graph is commonly associated with a quadratic polynomial function.
The maximum value of a downward-opening parabola occurs at its highest point, called the vertex.
From the graph, the highest point occurs at approximately:
t=9.5
This means the museum reaches its maximum daily profit approximately:
9.5 " years after opening "
The vertical axis represents daily profit in hundreds of dollars. From the graph, the maximum P(t)-value is approximately:
16.5
Since the profit is measured in hundreds of dollars:
16.5×100=1650
So the maximum daily profit is approximately:
$1,650
Therefore, the correct interpretation is:
" Approximately 9.5 years after opening, a maximum daily profit of approximately " $1,650 " was earned. "


Submit