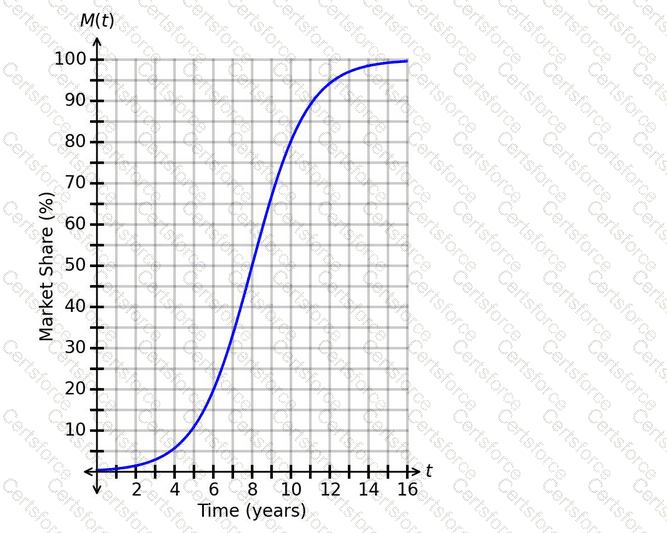
The function M(t)represents the company’s market share after tyears.
The horizontal axis represents:
t= " time in years "
The vertical axis represents:
M(t)= " market share percentage "
We need to find when the market share reaches:
40%
From the graph, locate 40on the vertical axis. Then move horizontally to the blue curve and read the corresponding value on the horizontal axis.
The curve reaches 40%at approximately:
t=7.4
So the company should expect to have a market share of 40%after about:
7.4 " years "
Therefore, the correct answer is:
▭ ( " C " )
Contribute your Thoughts:
Chosen Answer:
This is a voting comment (?). You can switch to a simple comment. It is better to Upvote an existing comment if you don't have anything to add.


Submit