
Based on collected data, the number of registered voters in a district can be modeled using the function
f(x)=1,300× 〖 0.92 〗 ^x
whose graph is shown, where xrepresents the number of years since 2001 and f(x)represents the number of registered voters.
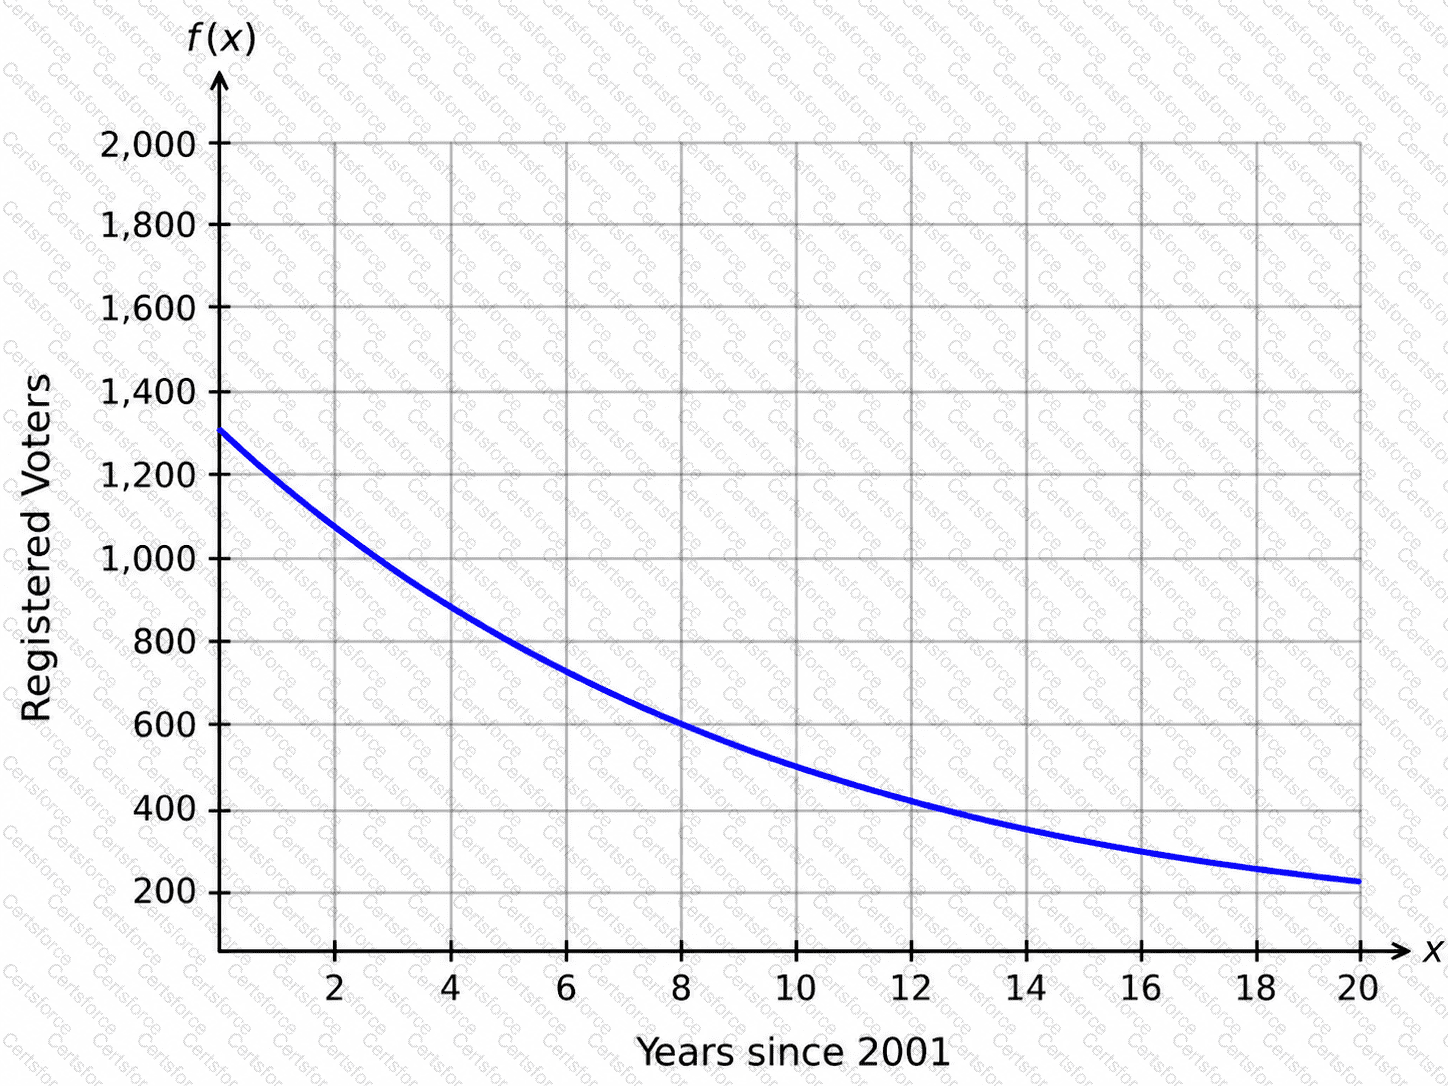
Which time period has the fastest average decrease in the number of registered voters?
The graphed function n(t)represents the number of animals, n, at a feeding station thours after 5:00 a.m. The plotted points Aand Bhave coordinates (1│10.6)and (8│6.59).
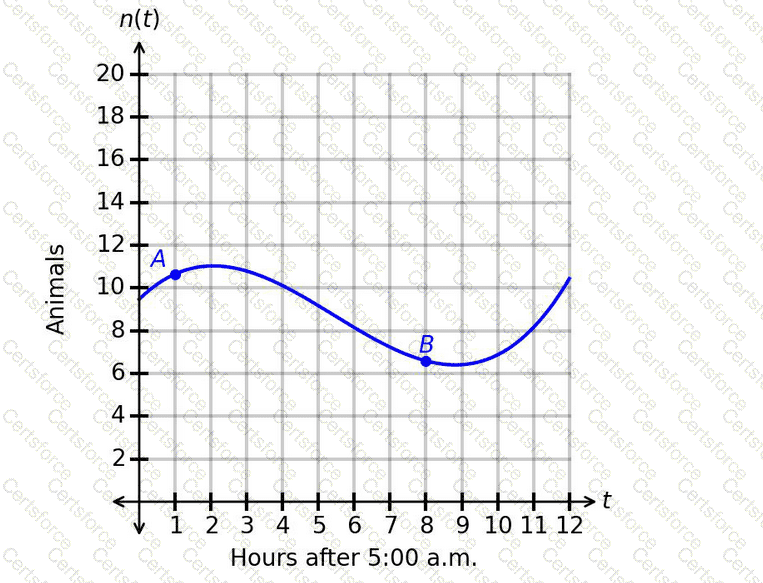
Which statement gives the correct interpretation of the average rate of change of the number of animals over the interval from point Ato point B?
The figure displays the graphs of two functions representing the heights, h_1and h_2, in feet, of two balls tseconds after being launched.
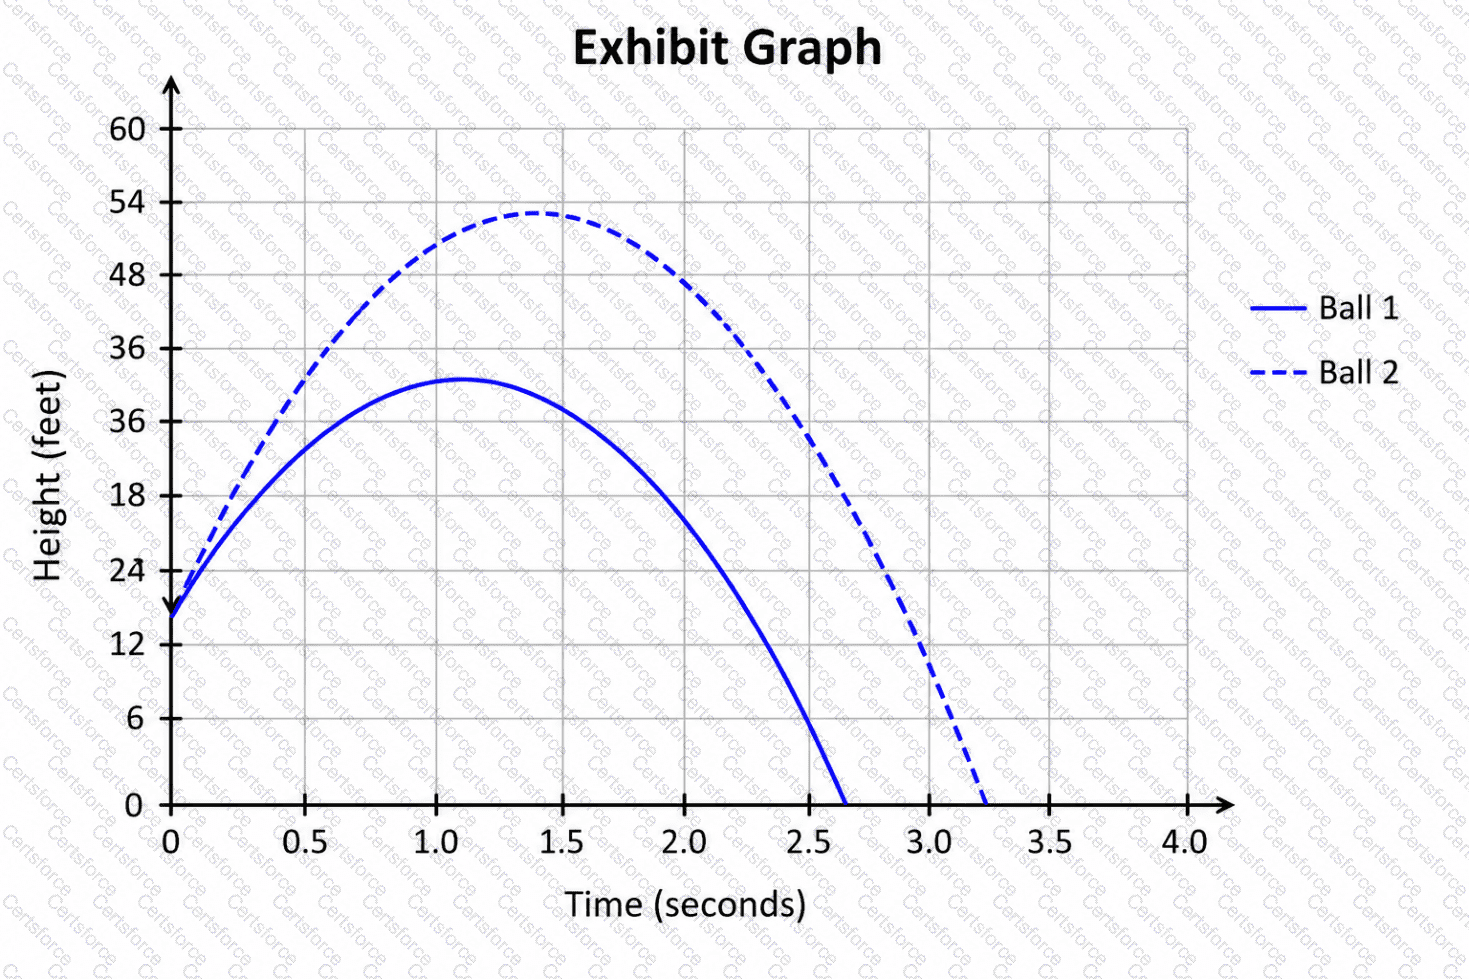
Which ball was lower 0.9seconds after being launched?
The values, in dollars, of two accounts over time are modeled by
A_1 (t)=6,500× 〖 1.05 〗 ^t
and
A_2 (t)=3,000× 〖 0.96 〗 ^t
The variable tis measured in years.
What is the difference between the accounts after 3 years?
The value of a collectible coin can be modeled by F(t), where t represents years since the number of years since the coin was found, and the vertical axis represents the value, in thousands of dollars.
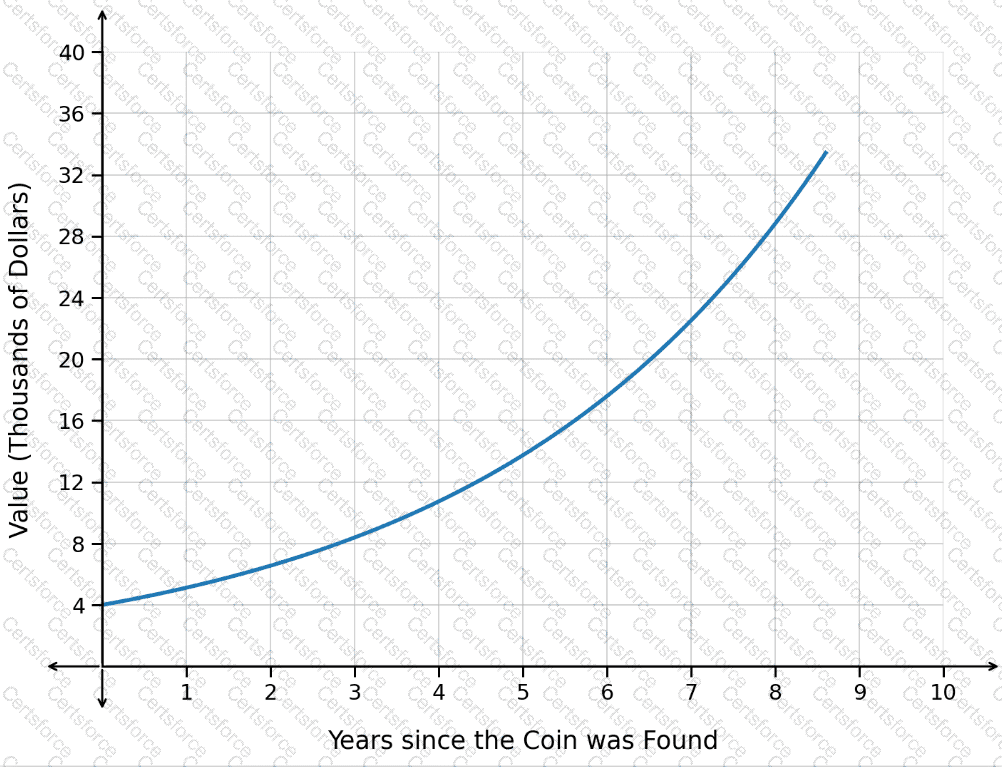
How is the value of the coin changing over time based on the graph?
The population of fish in a lake is changing according to the function P(t)=31t+438, where t is the number of months since the beginning of the year and P(t) is the fish population at time t. Which interpretation of the rate of change is correct?
The number of acres affected by an invasive species can be modeled using the logistic function f(x), where xrepresents the number of months since the species was introduced and f(x)represents the number of affected acres. The graph of f(x)is shown.
What happens as time progresses from month 2 to month 6?
The graph shows the estimated wait time, in minutes, based on the number of hours after 7:00 a.m.
What is the average rate of change of the wait time from point Ato point B?
A researcher collected data on the number of members in a national association over time. The results are shown in the scatterplot. The graphed regression function has an r^2value of 0.54.
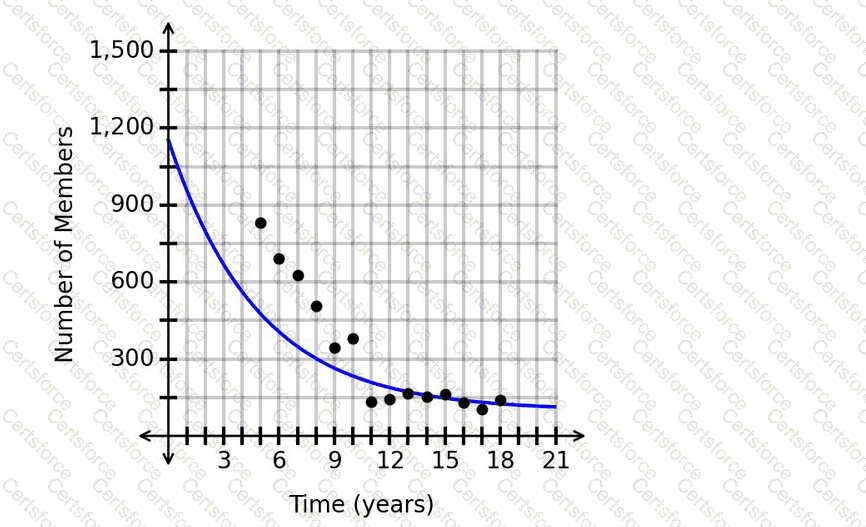
Is it appropriate to make a prediction for the number of members after 20.6years?
The graph shows the number of user accounts on a social media website over time.
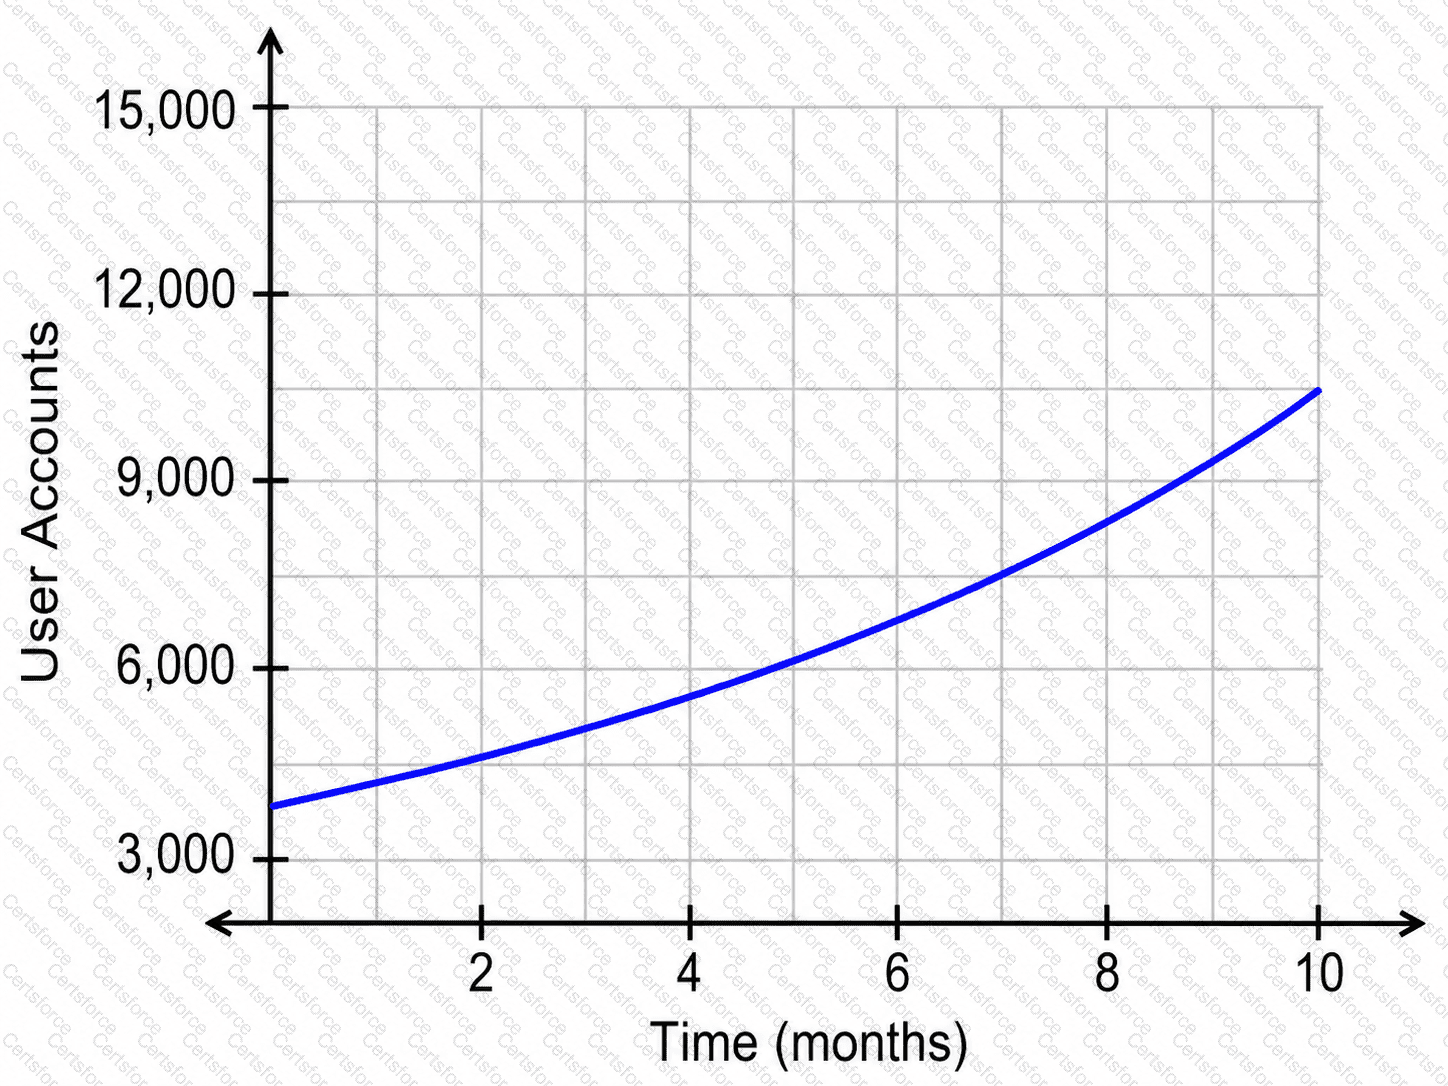
When did the number of user accounts reach 4,500?
