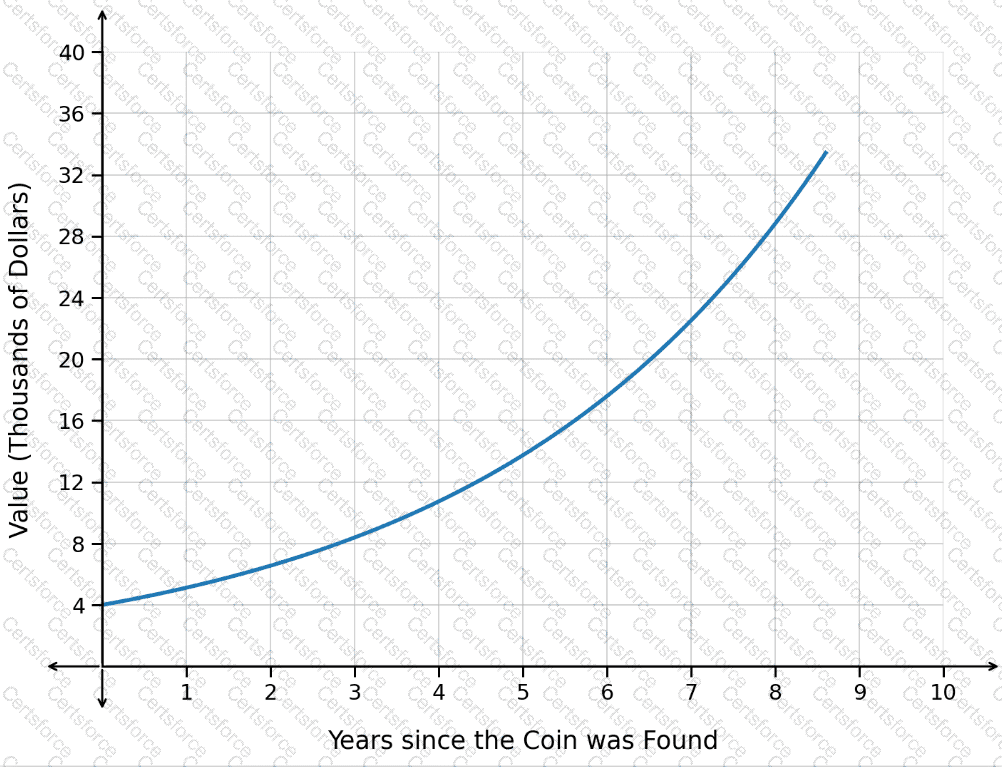
The graph shows population in thousands, and the horizontal axis represents:
" years since 1995 "
Point Pis located at approximately:
x=12
Since xrepresents years since 1995:
1995+12=2007
So point Pcorresponds to the year:
2007
The instantaneous rate of change at point Pis:
3.74
Because the vertical axis is measured in thousands, this means:
3.74 " thousand animals per year "
Convert thousands to actual animals:
3.74×1000=3740
So in 2007, the population was increasing by approximately:
3,740 " animals per year "
Contribute your Thoughts:
Chosen Answer:
This is a voting comment (?). You can switch to a simple comment. It is better to Upvote an existing comment if you don't have anything to add.
Submit