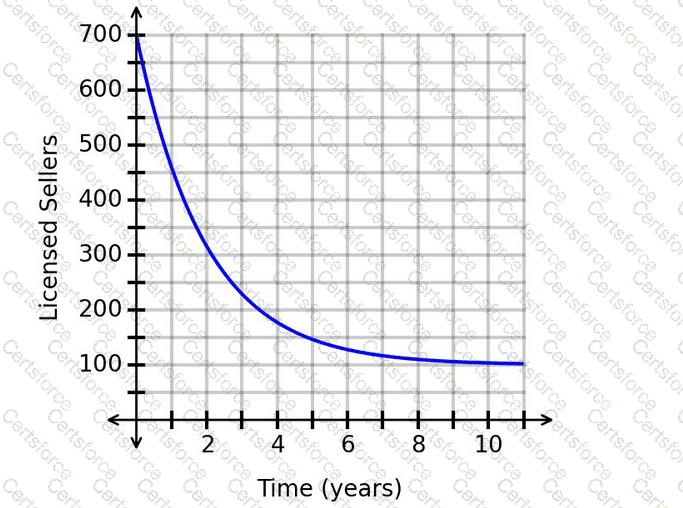
The graph starts near 700 licensed sellers and decreases over time. However, it does not appear to decrease all the way to 0. Instead, it levels off near:
y=100
That horizontal line is the horizontal asymptote.
A horizontal asymptote represents the long-term value the function approaches as time continues.
So the correct interpretation is:
" In the long run, the number of licensed sellers nears 100. "
Therefore, the correct answer is:
▭ ( " C " )
Contribute your Thoughts:
Chosen Answer:
This is a voting comment (?). You can switch to a simple comment. It is better to Upvote an existing comment if you don't have anything to add.


Submit