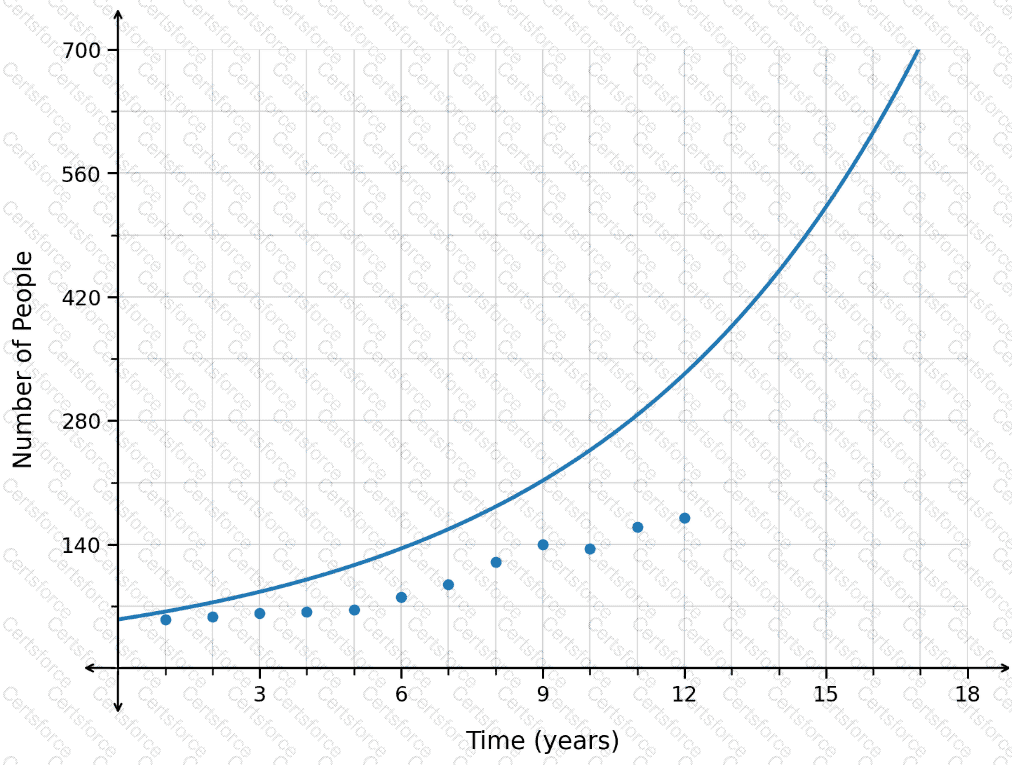
This graph represents a logistic growth function, which has an S-shaped curve:
Slow growth at the beginning (near point A)
Rapid growth in the middle (near point B and C)
Slowing growth at the end (near point D)
Key Concept:
Instantaneous rate of change = slope of the tangent line at a single point
Average rate of change = slope between two points
Analyze the graph:
At point A → slope is small (slow increase)
From A to C → increasing but not maximum
At point C → curve is steepest → maximum slope
From C to D → curve flattens → smaller slope
At point D → slope is very small (almost flat)
Conclusion:
The greatest rate of change occurs where the graph is steepest, which is at:
" Point C "
Submit