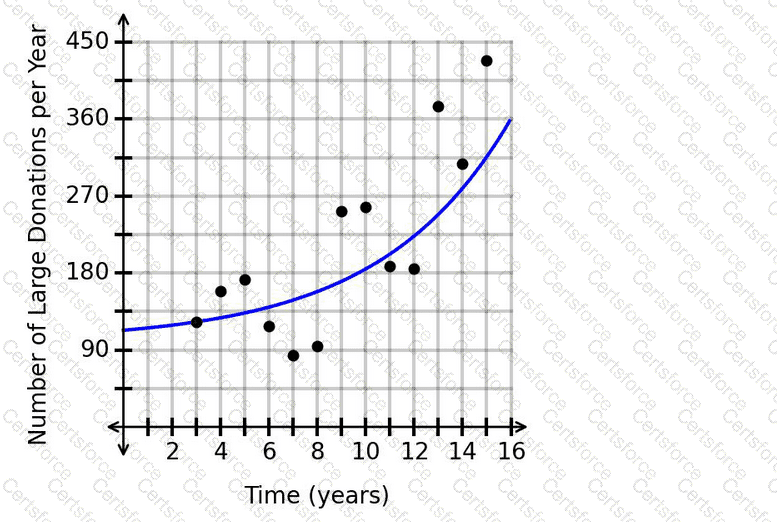
The scatterplot shows data collected over time, and a regression curve is used to model the pattern.
Extrapolation means using a model to make predictions slightly outside the observed data range. In Applied Algebra, extrapolation can be appropriate when:
" the regression model fits the data reasonably well "
and the predicted x-values are not too far outside the observed data.
From the scatterplot, the data points appear to run approximately from:
x=3 " to " x=15
So the observed data range is about:
15-3=12
A reasonable extrapolation range extends a little beyond the data, but not too far. The interval:
x=0 " to " x=18
extends about 3 units beyond each side of the observed data, which is reasonable.
The interval:
x=-3 " to " x=21
extends much farther beyond the data and would be less reliable.
Also, r^2does not have to equal exactly 1 for extrapolation to be useful. A value less than 1 can still represent a strong model.
Therefore, the correct answer is:
▭ ( " A " )


Submit