In a dataset, a Data Analyst has a string field named Category that contains unnecessary trailing spaces.
Which function should the analyst use to remove the trailing spaces from the Category field?
You have the following dataset.
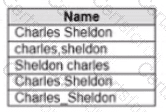
Which grouping option should you use m Tableau Prep to group al five names automatically?
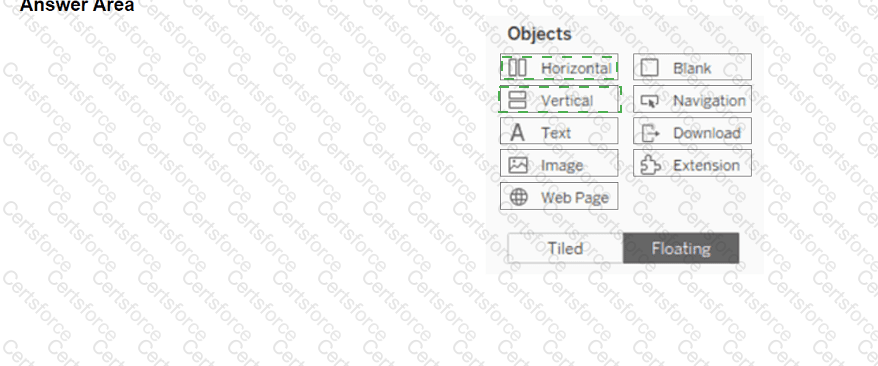
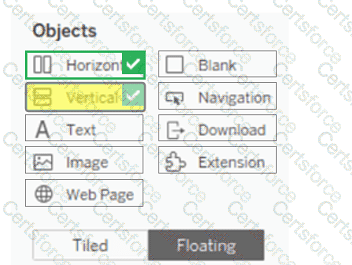
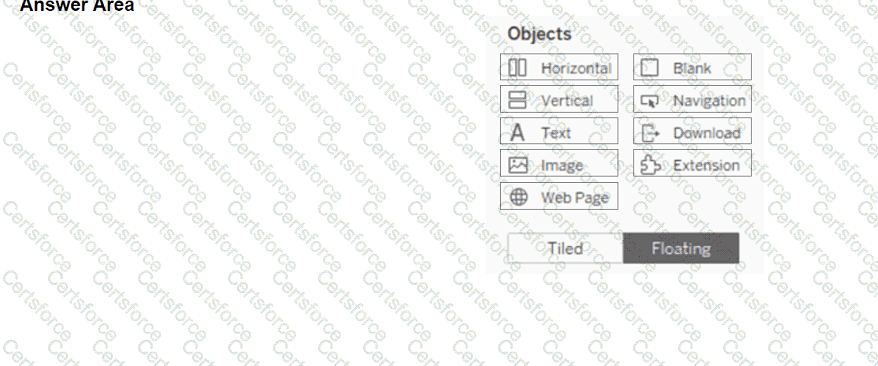
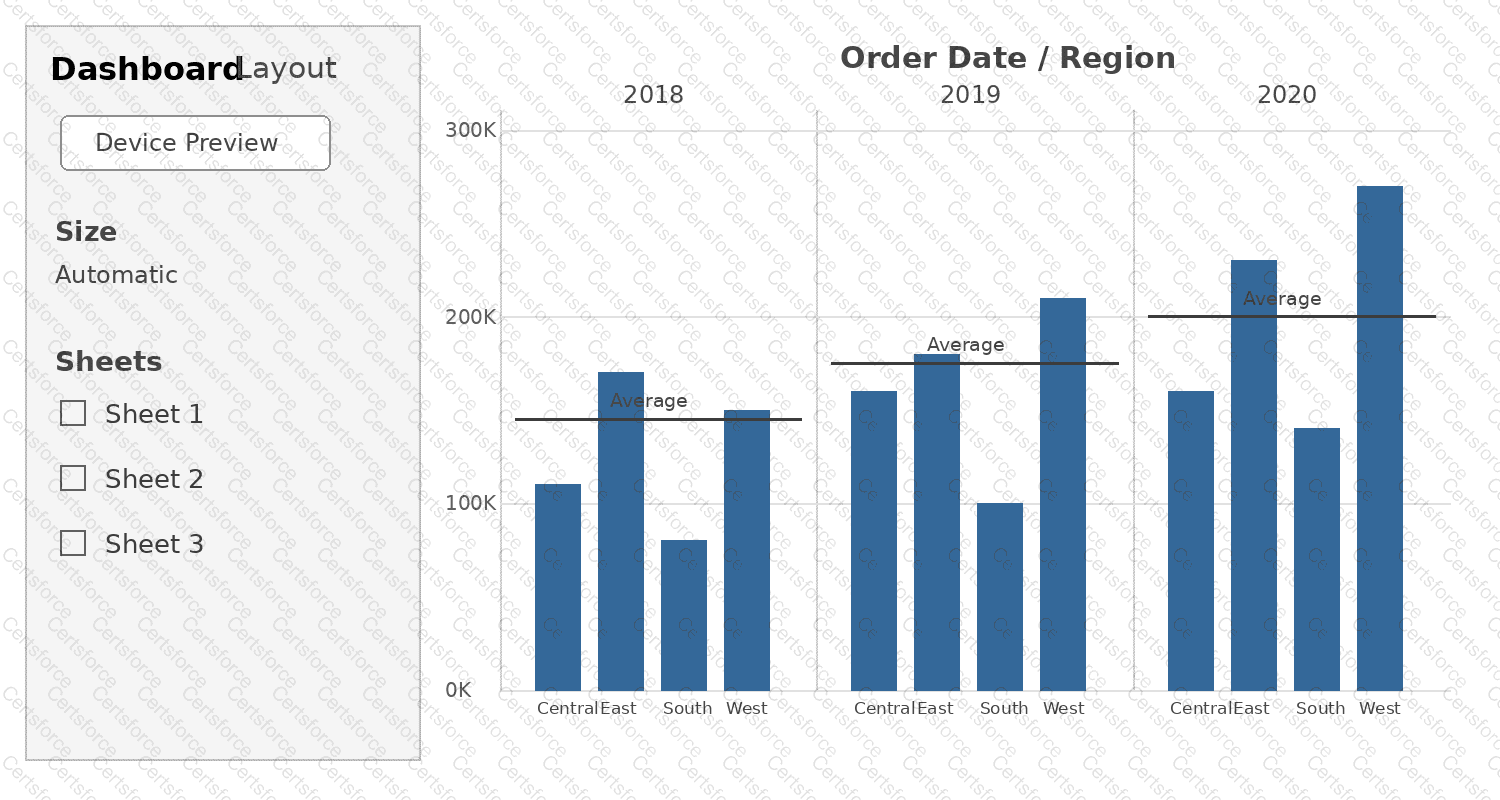
You have a blank dashboard.
You want to add two sheets to the dashboard. The sheets must support the Show/Hide button.
To which two objects can you add the sheets? (Click the two appropriate Options in the Answer Area.)
A Data Analyst has the following chart.
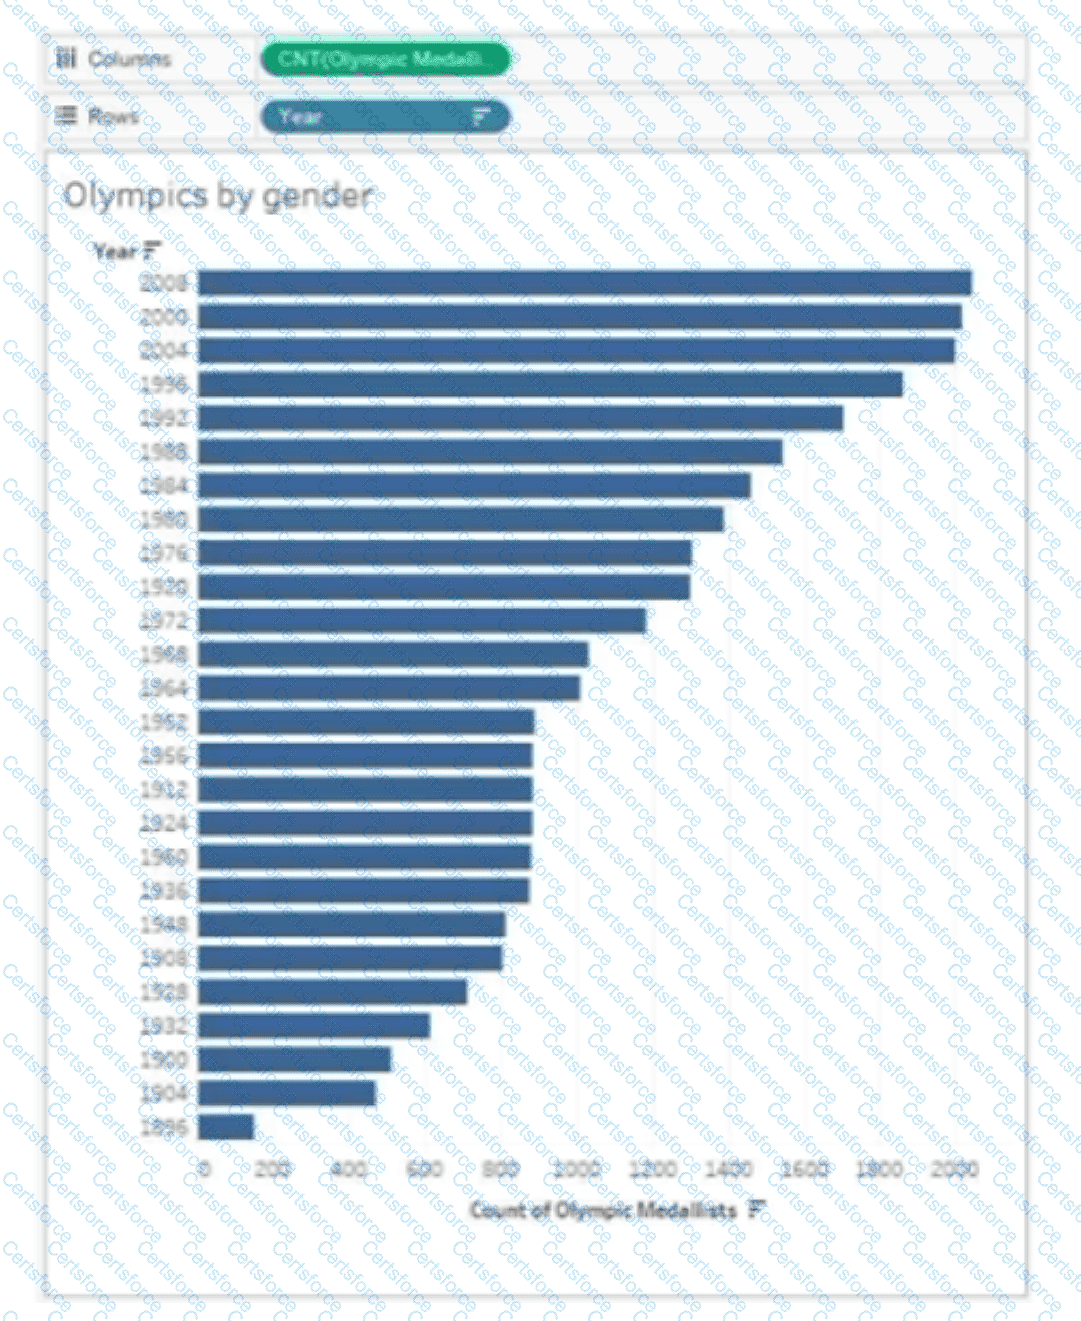
The analyst needs the top 10 values to appear in a different color. The top 10 values must be colored dynamically.
What should the analyst do?
You create the following story that contains two story point.
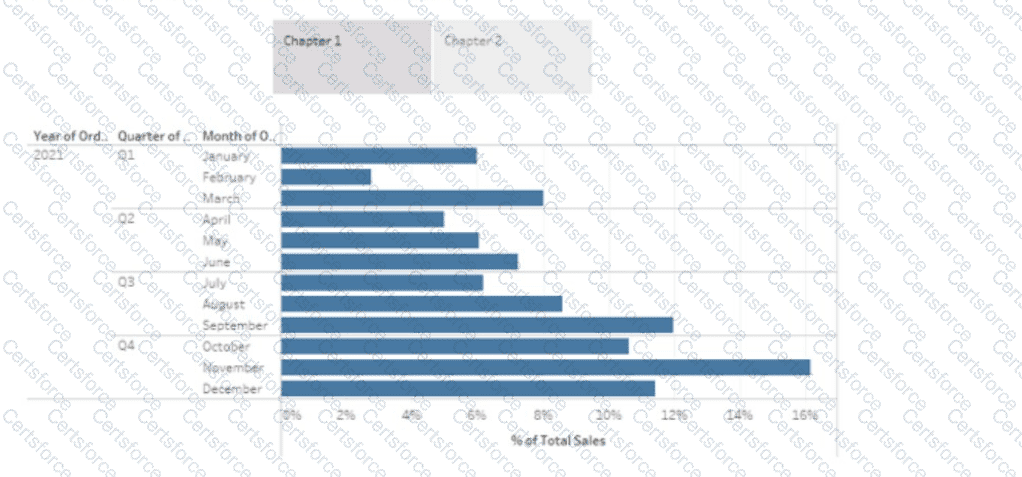
You want to change the story point format to show the current story point number out of the total number of story points.
Which Layout option should you use?
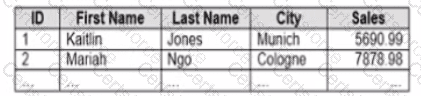
You company has two divisions located in the United States and Germany Bach division has a separate database. The following is a sample of the sales data for the division in the United States.
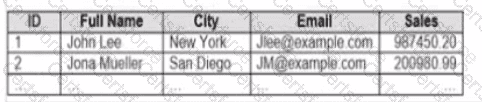
The following is a sample of the sales data for me division in Germany.
You have population data in a file named Populatio.csv. the following is a sample of the data.
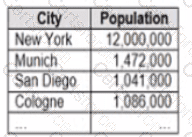
You plan to create a visualization that ml show tie sales per capita for each salesperson Each salesperson must be identified by identified by their full name.
You need to prepare the data to support the planned visualization. The data source must support being published .
Which four actions should you perform in order?
(Place the four correct options n order Use the arrows to move Options to Answer Area arrows to re-order the options.
Use Answer Area arrows to re-order the options)

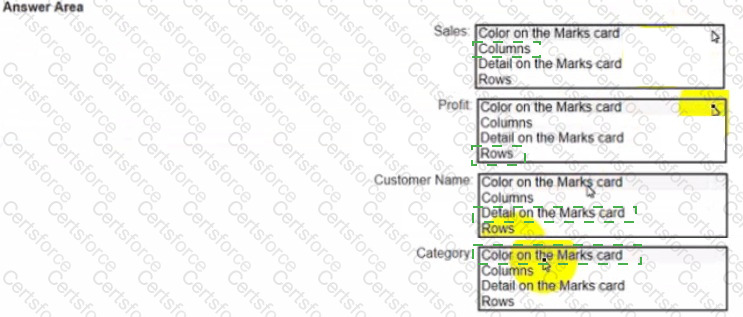
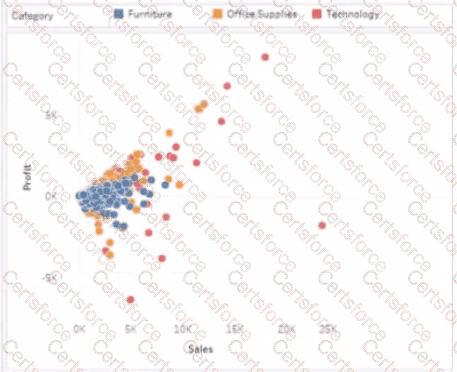
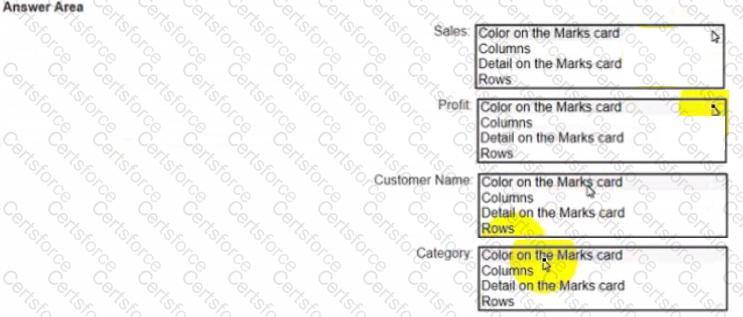
You have a dataset that has four fields named Category. Profit Sates and Customer Name. You need to create the following visualization.
You want to add a comment to March 2020 as shown in the following visualization.
You have the following sets in a Tableau workbook
• Top N Customers
• Customers of 2020
• Top N Products
• Sellers of 2020
Which two sets can you combine? Choose two
A Data Analyst has the following tiled dashboard that has one sheet called Sheet 3.
The analyst wants to replace the sheet with Sheet 2.
What should the analyst do?
You publish a dashboard that uses an extract. The extract refreshes every Monday at 10:00.
You need to ensure that the extract also refreshes on the last day of the month at 18:00.
What should you do?