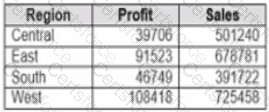
You have the following dataset.
You need to create the following worksheet.
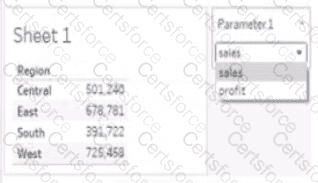
The table must show either profit or sales based on the selection from the Parameter 1 menu.
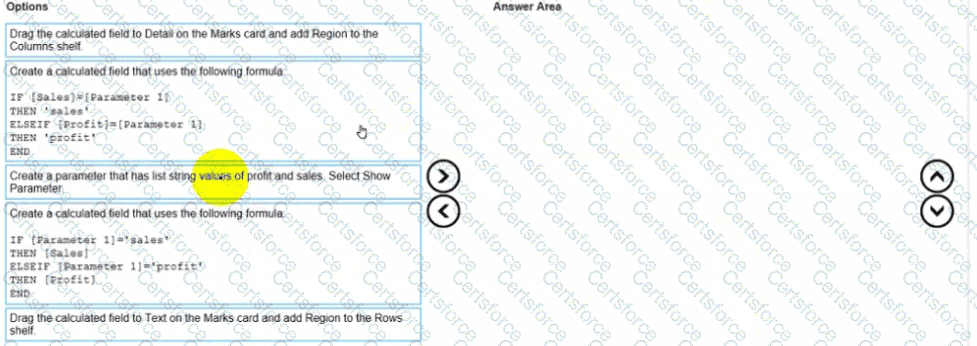
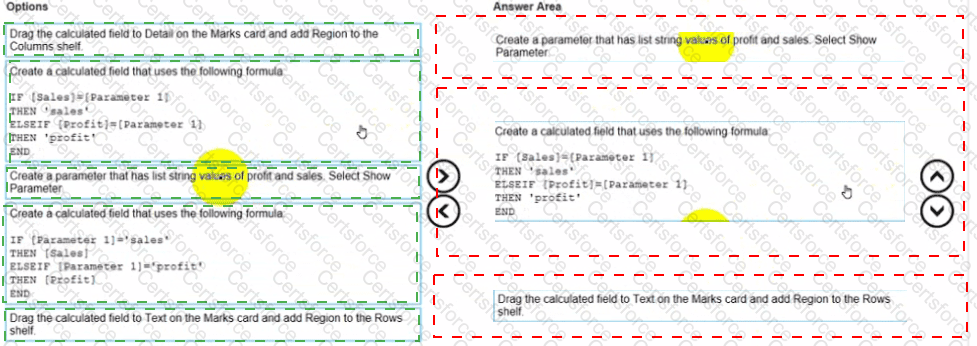
Which three actions should you perform in orders
(Place the three correct options in order Use the arrows to move Options lo Answer Area Use Answer Area arrows to reorder the options)
Submit