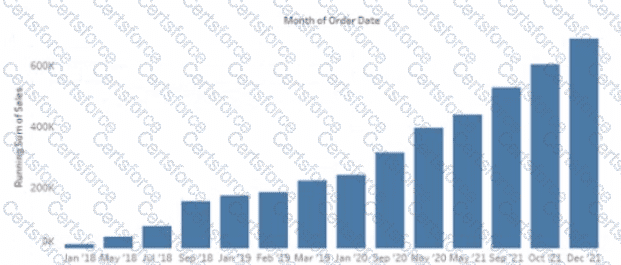
You have the following chart that shows the cumulative of sales from various dates.
You want the months to appear as shown in the following chart.
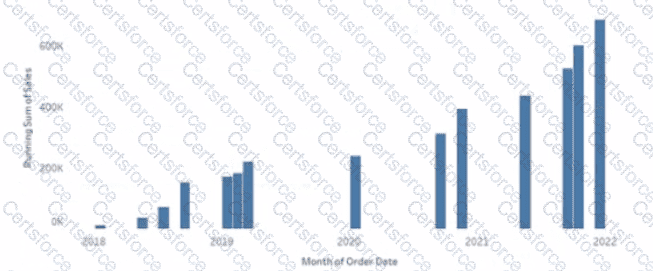
What should you do?
A Data Analyst needs to analyze the financial performance of the sales team. In order to make the dashboards easier to understand, the analyst needs to format the financial values to show the dollar symbol ($) in front of the value.
How should the analyst enable this formatting across the workbook?
You publish a dashboard that uses an extract. The extract refreshes every Monday at 10:00.
You need to ensure that the extract also refreshes on the last day of the month at 18:00.
What should you do?
Which syntax should a Data Analyst use to find the first purchase date per customer when Customer is not in the view?
In a dataset, a Data Analyst has a string field named Name that contains unnecessary semicolons.
Which function should the analyst use to remove the semicolons from the Name field?
You have the following dataset.
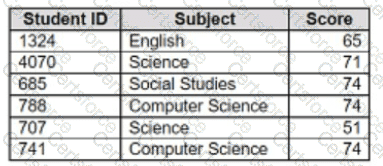
You want to create a new calculated dimension field named Category that meets the following conditions:
. When Subject is Computer Science or Science, Category must be Sciences.
. When Subject is English or Social Studies, Category must be Humanities.
Which two logical functions achieve the goal? Choose two.
You have the following dashboard.
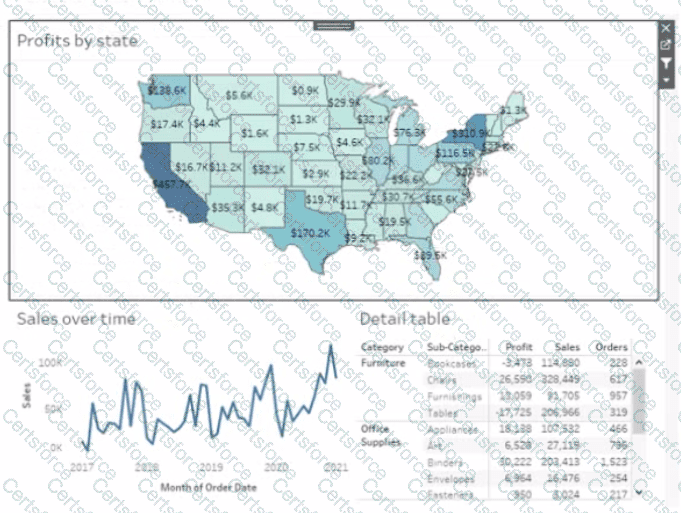
Currently the map is used as a filter that affects the data on the otter sheets of the dashboard
You need to configure the dashboard to ensure that selecting a data point on the map only tillers the Detail table
What should you do?
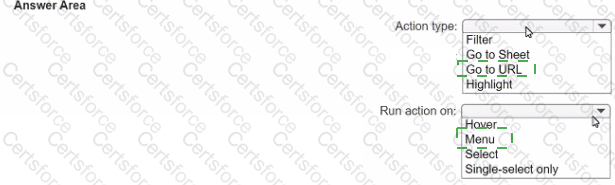
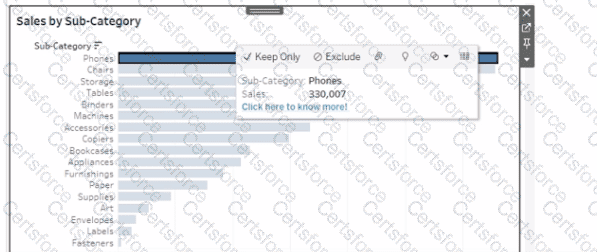
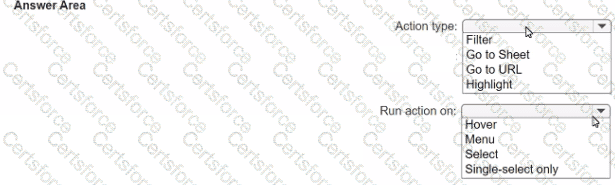
You want to ensure that when you click a bar on a dashboard, a tooltip appears that contains a link named " Click here to know more! " as shown in the following exhibit.
You connect to a database server by using Tableau Prep. The database server has a data role named Role1.
You have the following field in the data.

You need to apply the Role1 data role to the Material field.
Which two actions should you perform? Choose two.
A Data Analyst has the following chart that shows the sum of sales made in different cities.
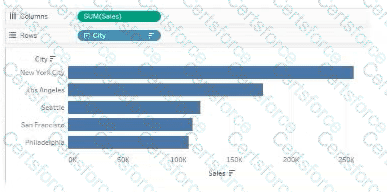
The analyst wants to show the average sale amount for a city when users hover their mouse over any of the bars.
What should the analyst do?