Summer Certification Special Limited Time 70% Discount Offer - Ends in 0d 00h 00m 00s - Coupon code: force70

Salesforce Certified Tableau Data Analyst Analytics-DA-201 Question # 40 Topic 5 Discussion

Salesforce Certified Tableau Data Analyst Analytics-DA-201 Question # 40 Topic 5 Discussion

Analytics-DA-201 Exam Topic 5 Question 40 Discussion:
Question #: 40
Topic #: 5

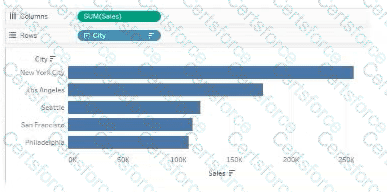
A Data Analyst has the following chart that shows the sum of sales made in different cities.

Analytics-DA-201 Question 40

The analyst wants to show the average sale amount for a city when users hover their mouse over any of the bars.

What should the analyst do?


A.

Right-click on SUM(Sales) in the Columns and select Include in Tooltip.


B.

Drag Sales to Tooltip on the Marks card and change Aggregation to Average.


C.

Drag Sales to Tooltip on the Marks card and modify the Tooltip text.


D.

Right-click on SUM(Sales) in the Columns and change Aggregation to Average.


Get Premium Analytics-DA-201 Questions

Contribute your Thoughts:


Chosen Answer:
This is a voting comment (?). It is better to Upvote an existing comment if you don't have anything to add.