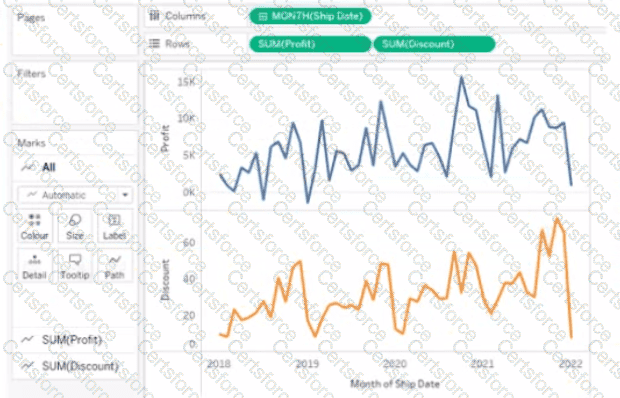
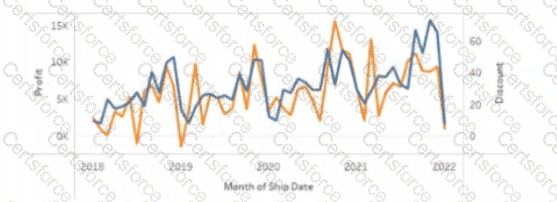
To combine the lines to appear as shown in the second chart, you should set Discount to Dual Axis. Dual Axis is a feature that allows you to show two measures on two separate axes on one chart. You can create a dual axis by right-clicking on a measure on any shelf and selecting Dual Axis from the menu. This will create two axes on one chart and synchronize their scales.
In this case, you want to show Profit and Discount on two separate axes on one chart. You can right-click on Discount on any shelf and select Dual Axis from the menu. This will create a dual axis chart that shows Profit and Discount as two lines with different colors.
The other options are not correct for this scenario. Dragging Discount to Color on the Marks card will change the color of Profit based on Discount, but it will not show two lines. Converting Discount to Discrete will change Discount from a green pill to a blue pill, but it will not affect how it appears on the chart. Dragging Discount to Columns shelf will create two separate charts for Profit and Discount, but it will not combine them. References: https://help.tableau.com/current/pro/desktop/en-us/multiplemeasures.htm https://help.tableau.com/current/pro/desktop/en-us/multiplemeasures_dualaxes.htm
Contribute your Thoughts:
Chosen Answer:
This is a voting comment (?). You can switch to a simple comment. It is better to Upvote an existing comment if you don't have anything to add.
Submit