In a class of 40 students, the following data were collected on their favorite sport:
Soccer: 10 students
Basketball: 15 students
Tennis: 5 students
Swimming: 10 students
What is the relative frequency of students whose favorite sport is not basketball?
Type I error = ?
Regression R² = 0.64. Interpretation?
Probability of at least one six in 2 dice rolls = ?
Sample mean = 40, SD = 8, n = 16. Standard error = ?
Probability of rolling 1, 2, or 3 on die = ?
A teacher compares the test scores of two classes using a box plot.
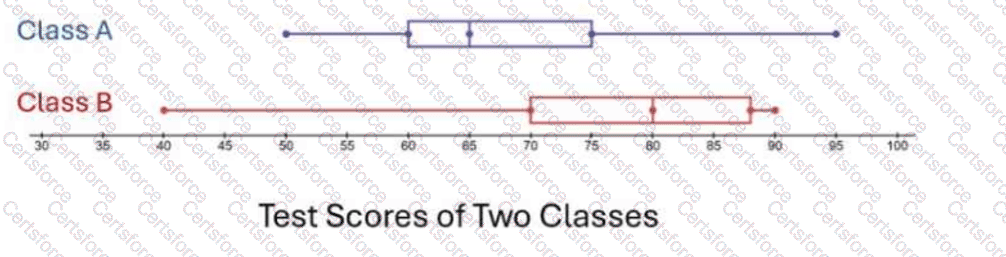
What is true about the median test scores?
Standard deviation squared = ?
The pie chart shows the contribution of different renewable energy sources to the total energy production.
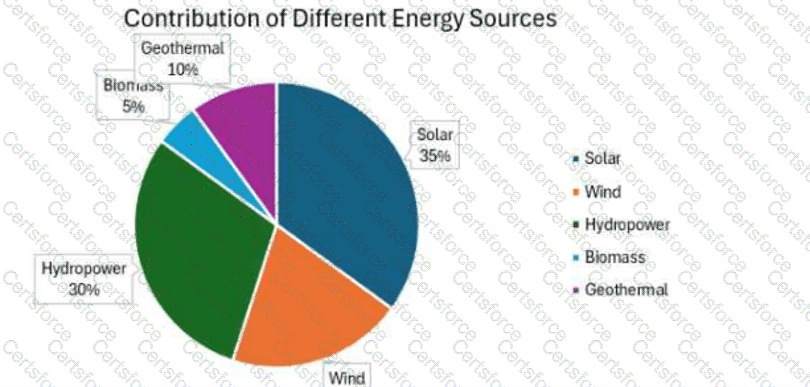
What is true about the given data?
A teacher plots the test scores of a class using the box plot.
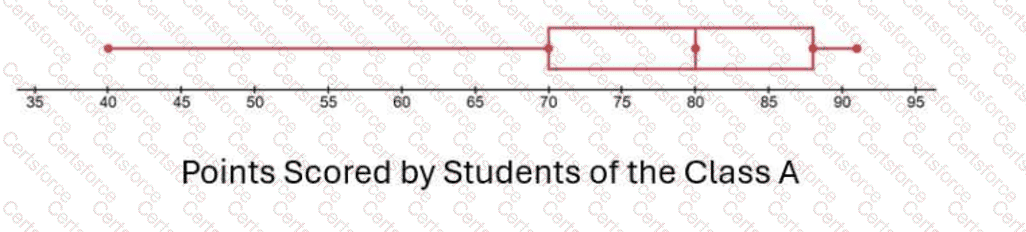
What is the interquartile range?