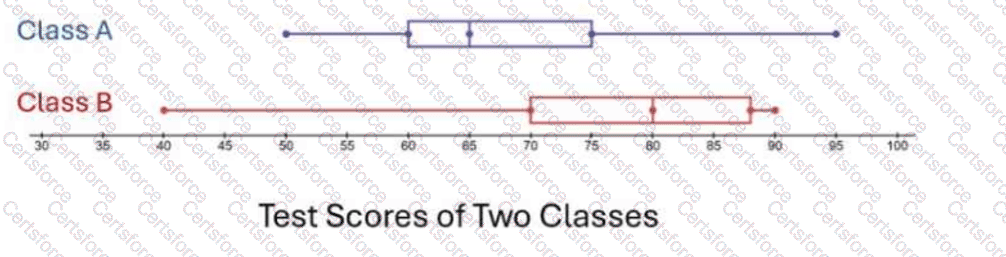
A box plot displays the five-number summary, including the median, which is shown by the vertical line inside each box. In the exhibit, the median for Class A is positioned at approximately 65, while the median for Class B is positioned at approximately 80. The difference is therefore 80 − 65 = 15 points. Since Class A’s median is lower, the correct interpretation is that the median test score of Class A is 15 points less than that of Class B. This comparison uses a categorical grouping variable, class, and a quantitative response variable, test score. The box plot is appropriate because it allows the distributions of two groups to be compared visually using medians, quartiles, ranges, and potential spread. Options A, B, and D do not match the median locations shown by the center lines in the boxes. References/topics from the Study Guide: box plots, median, five-number summary, comparing distributions.
============
Contribute your Thoughts:
Chosen Answer:
This is a voting comment (?). You can switch to a simple comment. It is better to Upvote an existing comment if you don't have anything to add.
Submit