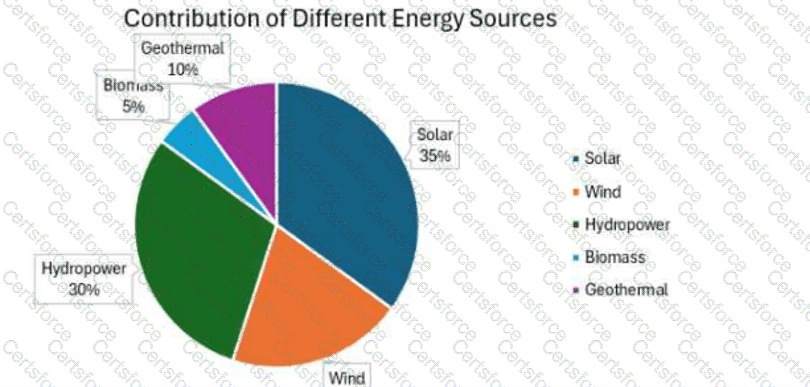
A pie chart displays how a whole is divided into categorical parts, usually as percentages totaling 100%. The chart shows solar at 35%, hydropower at 30%, wind at 20%, geothermal at 10%, and biomass at 5%. The largest percentage is solar, so solar power contributes the most to total energy production. Option A is false because hydropower plus biomass equals 30% + 5% = 35%, which is equal to solar, not more than solar. Option B is false because geothermal is 10%, while biomass is only 5%; therefore, biomass contributes the least. Option C is false because biomass plus geothermal equals 5% + 10% = 15%, which is less than wind at 20%. The correct interpretation requires comparing category percentages accurately rather than relying on visual size alone. References/topics from the Study Guide: pie charts, categorical data, percentages, interpreting graphical displays.
============
Contribute your Thoughts:
Chosen Answer:
This is a voting comment (?). You can switch to a simple comment. It is better to Upvote an existing comment if you don't have anything to add.
Submit