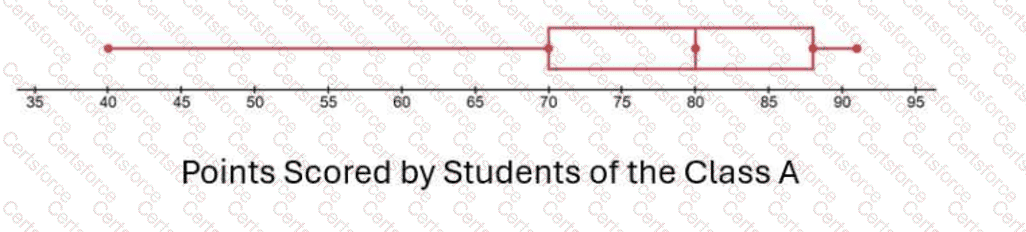
The interquartile range, abbreviated IQR, measures the spread of the middle 50% of a data set. In a box plot, the left edge of the box represents the first quartile, Q1, and the right edge of the box represents the third quartile, Q3. The IQR is computed as Q3 − Q1. In the displayed box plot, Q1 is located at 70 points and Q3 is located at approximately 88 points. Therefore, the interquartile range is 88 − 70 = 18 points. The median, shown by the line inside the box, is about 80 points, but the median is not used in the IQR calculation. The whiskers show the approximate minimum and maximum values, but those define the full range, not the interquartile range. The correct answer is 18 points. References/topics from the Study Guide: box plots, quartiles, interquartile range, five-number summary.
============
Contribute your Thoughts:
Chosen Answer:
This is a voting comment (?). You can switch to a simple comment. It is better to Upvote an existing comment if you don't have anything to add.
Submit