
Universal Containers builds a new sales dashboard and wants to makesure account managers can access the dashboard while traveling.
What should the consultant consider doing in this process?
Universal Containers (UC) uses a Microsoft Azure SQL Data Warehouse to gather information about sales reps' objectives. UC wants to use CRM Analytics to gain insights from this data and automatically load it into a CRM Analytics dataset daily. The data also needs to be transformed and merged with data from the company's org.
Which CRM Analytics user interface features should be used to complete these requirements?
The CRM Analytics consultant at Universal Containers (UC) has set up data sync for the Salesforce Opportunity object with the Amount currency field added. This is being used in multiple datasets and dashboards, as UC is a multi-currency organization.
The currency used in Salesforce records is set up in GBP but the data on the dashboard is converting to USD. Conversion logic is not set up on any of the recipes.
Why is the currency converting?
Universal Containers' CRM Analytics team is building a dashboard with two widgets, and the queries use different datasets.
1. List widget associated to the query "Type_2" and grouped by the dimension "Type" (multi-selection)
2. Donut chart widget associated to the query "Query_pie_3" and grouped by the dimension "Type"
The team wants any selection in the List widget to filter the Donut chart and vice versa. Users should be able to choose more than one Type (multi-selection).
What is the recommended way to accomplish the required filtering?
Which statement best describes how to ensure CRM Analytics dashboards are easily used across both desktop and mobile devices?
A versioning feature allows CRM Analytics users to be added as Publishers and make changes separately while a ‘Live’ version is still being usedby other users. Once the changes are complete, the user can then set their updated version as the Live version.
Which CRM Analytics item is this leveraged for?
A CRM Analytics consultant is asked to make changes to the current sales dashboard at Cloud Kicks. The dashboard is crucial to track the daily sales performance of the company and needs to be
available for other users while the consultant works on the changes.
How should the consultant proceed to update the dashboard?
Universal Containers has a dashboard for sales managers. They need the ability to visualize the number of Closed Won opportunities by month, quarter, or year, and then display the result in a single chart. A CRM Analytics consultant creates a custom query to display three values:
ClosedDate_month, ClosedDate_ quarter, and ClosedDate_year.
What should the consultant do next?
The marketing team at Cloud Kicks has five dashboards in an app. Four widgets are replicas of each other in three of the dashboards.
What is the best way to maintain these widgets?
Exhibit.
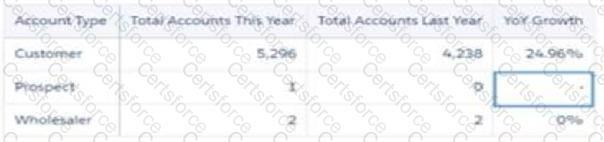
Universal Containers has a dashboard for sales managers to visualize the Year Over Year (YoY) growth of their customers. The formula used is:
YoY = [(This Year — Last Year) / Last Year] %
Based on the graphic, when there is not an account in the Last Year column, the YoY Growth shows null results. The sales managers want to replace it with 100% value.
What is the correct function to use?
