The graph shows the number of trees sold by a nursery, where the number of days since the beginning of the month is along the horizontal axis and the number of trees sold per day is along the vertical axis. The greatest number of trees are sold when the temperature is over 70°F.
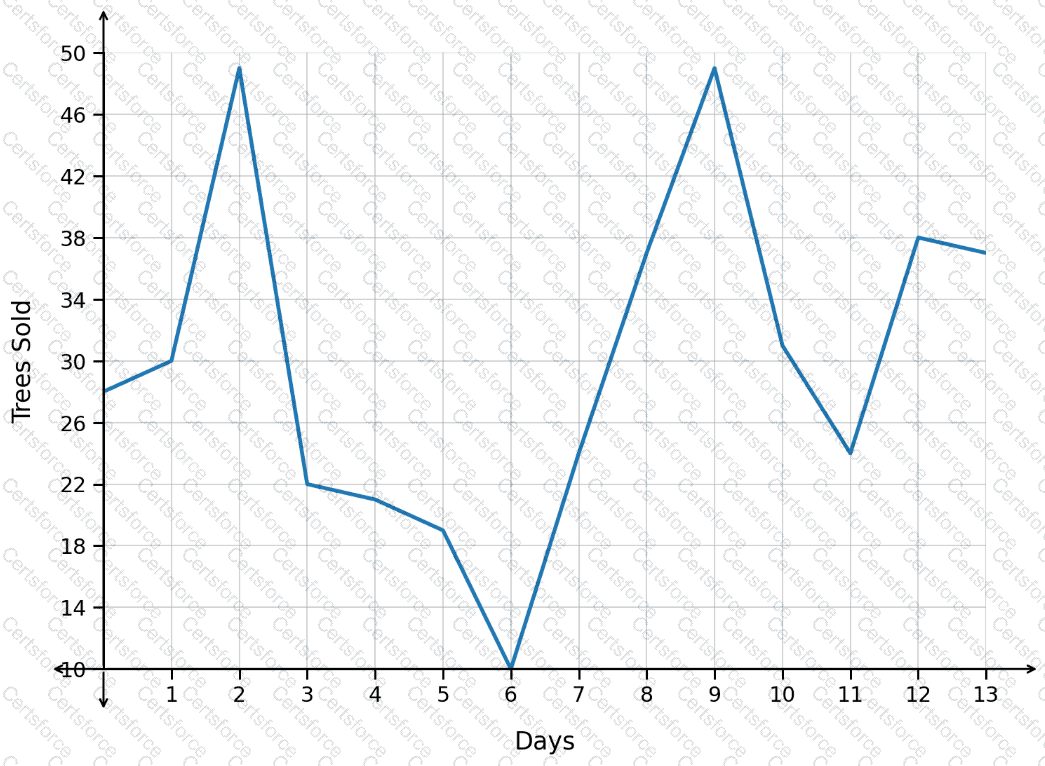
When was the temperature likely over 70°F?
Submit