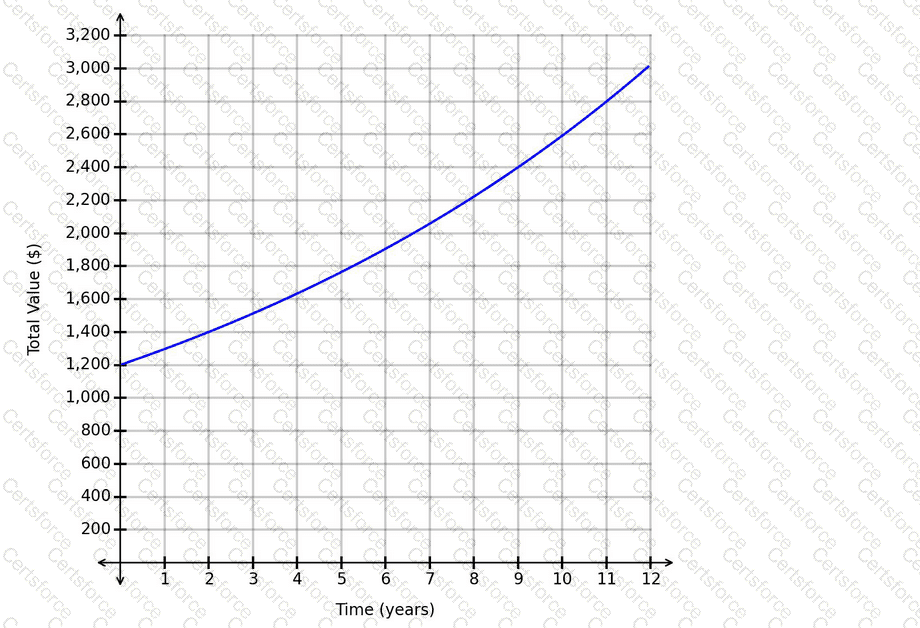
The graph shows the total value of an investment account as time increases.
The horizontal axis represents:
" Time in years "
The vertical axis represents:
" Total value in dollars "
We need to find the value of the account after:
8 " years "
From the graph, when t=8, the curve is slightly above $2,200. The closest answer choice is:
$2,221.12
So the value of the account after 8 years is approximately:
$2,221.12
Therefore, the correct answer is:
▭ ( " D " )
Contribute your Thoughts:
Chosen Answer:
This is a voting comment (?). You can switch to a simple comment. It is better to Upvote an existing comment if you don't have anything to add.
Submit