A team was assembled at a manufacturing plant in order to boost productivity. The team was tasked with producing as many widgets each day as possible. The results are shown in the graph.
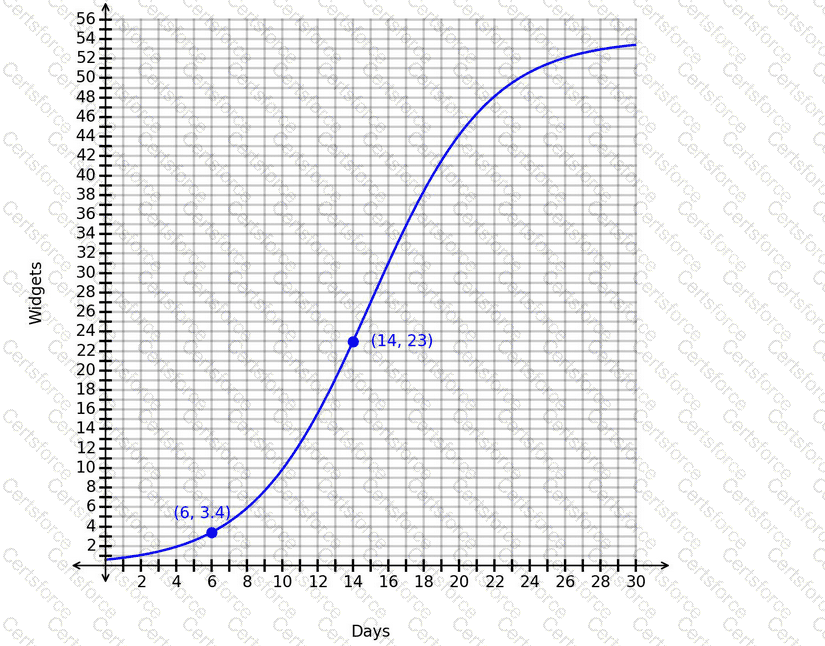
What is the correct interpretation of the average rate of change from day 6 to day 14?
Submit