A data analyst sets up a calculation to filter a dashboard so that it displays only the users' information. The dashboard will then be published to Tableau Cloud.
The data analyst plans to use the following calculation to filter the data: USERNAME() = [Correct Answer]
Which column in the table below should the data analyst reference in the calculation?

A worksheet uses a LOOKUP function to display Sales by Month, Year of Order Date, and sales from the last 12 months. A consultant wants to use a Relative Date Filter to filter for data from the last 12 months. However, when the consultant does this, the prior year's data is removed from the sheet.
Which two actions should the consultant take to retain the prior year's data after applying the filter? Choose two.
A client wants to produce a visualization to show quarterly profit growth and aggregated sales totals across a number of product categories from the data
provided below.
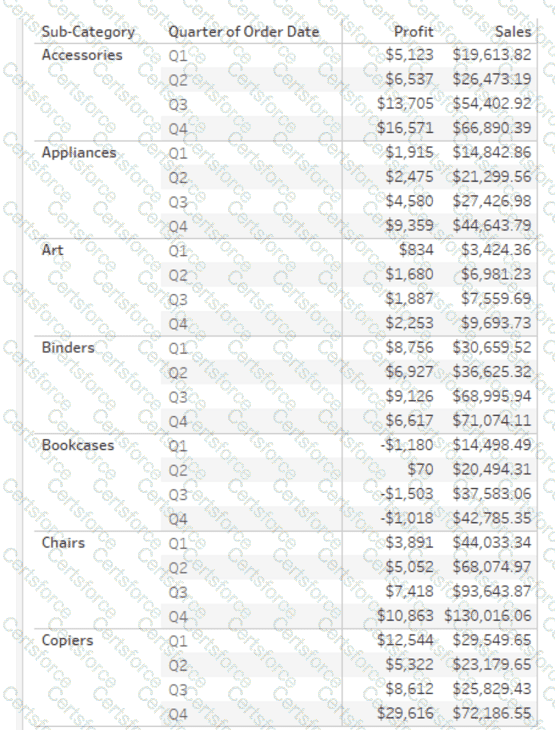
Which set of charts should the consultant use to meet the client's requirements?
A client calculates the percent of total sales for a particular region compared to all regions.

The Sales percentage is inadvertently recalculated each time the filter is applied to the Region.
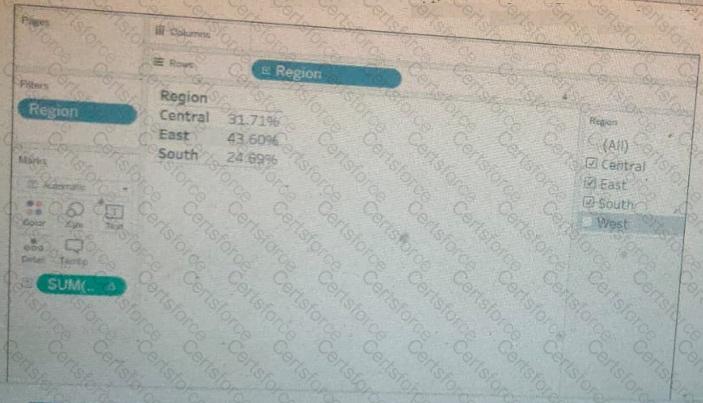
Which calculation should fix the automatic recalculation on the % of total field?
A client has a sales dataset that contains fields named Customer ID, Region, Item, and Sales Amount. Each row represents a single sale. There may be multiple sales for each Customer ID.
The client wants to visualize the average total customer sales by region.
Which Level of Detail (LOD) expression should a consultant recommend?
A client has a data source that stores a time stamp for each time a user interacts with a product feature. They visualize 3 years of data at the daily level. As adoption has grown over the last 6 months, the dashboard performance has steadily decreased, despite connecting via a data extract that is set to refresh every hour.
A Tableau consultant needs to improve performance of the dashboard with the least impact to the visualization.
Which option meets these requirements without additional cost?
A client notices that several groups are sharing content across divisions and are not complying with their data governance strategy. During a Tableau Server
audit, a consultant notices that the asset permissions for the client's top-level projects are set to "Locked," but that "Apply to Nested Projects" is not checked.
The consultant recommends checking "Apply to Nested Projects" to enforce compliance.
Which impact will the consultant's recommendation have on access to the existing nested projects?
A company has a data source for sales transactions. The data source has the following characteristics:
. Millions of transactions occur weekly.
. The transactions are added nightly.
. Incorrect transactions are revised every week on Saturday.
· The end users need to see up-to-date data daily.
A consultant needs to publish a data source in Tableau Server to ensure that all the transactions in the data source are available.
What should the consultant do to create and publish the data?
An online sales company has a table data source that contains Order Date. Products ship on the first day of each month for all orders from the previous month.
The consultant needs to know the average number of days that a customer must wait before a product is shipped.
Which calculation should the consultant use?
A client notices that while creating calculated fields, occasionally the new fields are created as strings, integers, or Booleans. The client asks a consultant if
there is a performance difference among these three data types.
What should the consultant tell the customer?