Big 11.11 Sale Limited Time 70% Discount Offer - Ends in 0d 00h 00m 00s - Coupon code: simple70

Salesforce Certified Tableau Consultant Analytics-Con-301 Question # 13 Topic 2 Discussion

Salesforce Certified Tableau Consultant Analytics-Con-301 Question # 13 Topic 2 Discussion

Analytics-Con-301 Exam Topic 2 Question 13 Discussion:
Question #: 13
Topic #: 2

A client wants to produce a visualization to show quarterly profit growth and aggregated sales totals across a number of product categories from the data

provided below.

Analytics-Con-301 Question 13

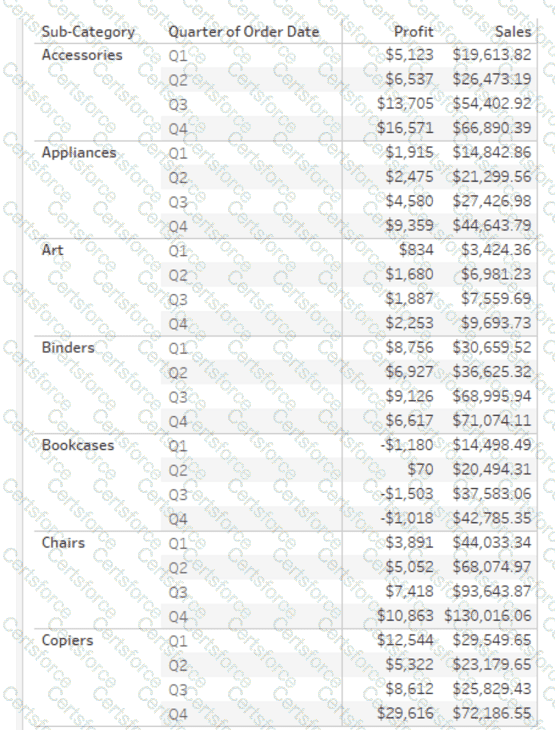
Which set of charts should the consultant use to meet the client's requirements?


A.

Line and bubble charts


B.

Waterfall chart and tree map


C.

Gantt and bar charts


D.

Scatter plot and pie chart


Get Premium Analytics-Con-301 Questions

Contribute your Thoughts:


Chosen Answer:
This is a voting comment (?). It is better to Upvote an existing comment if you don't have anything to add.