New Year Sale Limited Time 70% Discount Offer - Ends in 0d 00h 00m 00s - Coupon code: simple70

Pass the Salesforce Salesforce Consultant Analytics-Con-301 Questions and answers with CertsForce

Viewing page 3 out of 3 pages
Viewing questions 21-30 out of questions
Questions # 21:

A stakeholder has multiple files saved (CSV/Tables) in a single location. A few files from the location are required for analysis. Data transformation (calculations)

is required for the files before designing the visuals. The files have the following attributes:

. All files have the same schema.

. Multiple files have something in common among their file names.

. Each file has a unique key column.

Which data transformation strategy should the consultant use to deliver the best optimized result?

Options:

A.

Use join option to combine/merge all the files together before doing the data transformation (calculations).


B.

Use wildcard Union option to combine/merge all the files together before doing the data transformation (calculations).


C.

Apply the data transformation (calculations) in each require file and do the wildcard union to combine/merge before designing the visuals.


D.

Apply the data transformation (calculations) in each require file and do the join to combine/merge before designing the visuals.


Expert Solution
Questions # 22:

A consultant creates a histogram that presents the distribution of profits across a client's customers. The labels on the bars show percent shares. The consultant

used a quick table calculation to create the labels.

Now, the client wants to limit the view to the bins that have at least a 15% share. The consultant creates a profit filter but it changes the percent labels.

Which approach should the consultant use to produce the desired result?

Options:

A.

Use a calculation with TOTAL() function instead of a quick table calculation.


B.

Add the [Profit] filter to the context.


C.

Filter with a table calculation WINDOW_AVG(MIN([Profit]), first(), last())


D.

Filter with the table calculation used to create labels.


Expert Solution
Questions # 23:

A client wants to see the average number of orders per customer per month, broken down by region. The client has created the following calculated field:

Orders per Customer: {FIXED [Customer ID]: COUNTD([Order ID])}

The client then creates a line chart that plots AVG(Orders per Customer) over MONTH(Order Date) by Region. The numbers shown by this chart are far higher

than the customer expects.

The client asks a consultant to rewrite the calculation so the result meets their expectation.

Which calculation should the consultant use?

Options:

A.

{INCLUDE [Customer ID]: COUNTD([Order ID])}


B.

{FIXED [Customer ID], [Region]: COUNTD([Order ID])}


C.

{EXCLUDE [Customer ID]: COUNTD([Order ID])}


D.

{FIXED [Customer ID], [Region], [Order Date]: COUNTD([Order ID])}


Expert Solution
Questions # 24:

A client collects information about a web browser customers use to access their website. They then visualize the breakdown of web traffic by browser version.

The data is stored in the format shown below in the related table, with a NULL BrowserID stored in the Site Visitor Table if an unknown browser version

accesses their website.

Question # 24

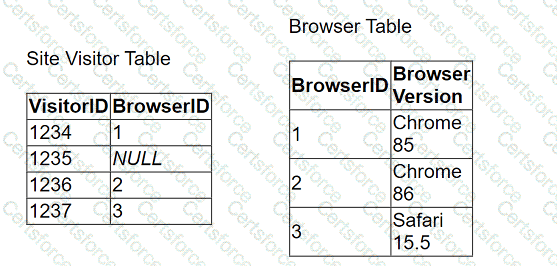
The client uses "Some Records Match" for the Referential Integrity setting because a match is not guaranteed. The client wants to improve the performance of

the dashboard while also getting an accurate count of site visitors.

Which modifications to the data tables and join should the consultant recommend?

Options:

A.

Continue to use NULL as the BrowserID in the Site Visitor Table and leave the Referential Integrity set to "Some Records Match."


B.

Add an "Unknown" option to the Browser Table, reference its BrowserID in the Site Visitor Table, and change the Referential Integrity to "All

Records Match."


C.

Add an "Unknown" option to the Browser Table, reference its BrowserID in the Site Visitor Table, and leave the Referential Integrity set to

"Some Records Match."


D.

Continue to use NULL as the BrowserID in the Site Visitor Table and change the Referential Integrity to "All Records Match."


Expert Solution
Questions # 25:

A client wants to report Saturday and Sunday regardless of the workbook's data source's locale settings.

Which calculation should the consultant recommend?

Options:

A.

DATEPART('weekday', [Order Date])>=6


B.

DATEPART('iso-weekday', [Order Date])>=6


C.

DATENAME('iso-weekday', [Order Date])>=6


D.

DATEPART('iso-weekday', [Order Date])=1 or DATEPART('iso-weekday', [Order Date])=7


Expert Solution
Questions # 26:

An executive-level workbook leverages 37 of the 103 fields included in a data source. Performance for the workbook is noticeably slower than other workbooks

on the same Tableau Server.

What should the consultant do to improve performance of this workbook while following best practice?

Options:

A.

Split some visualizations on the dashboard into many smaller visualizations on the same dashboard.


B.

Connect to the data source via a custom SQL query.


C.

Use filters, hide unused fields, and aggregate values.

OD. Restrict users from accessing the workbook to reduce server load.


Expert Solution
Viewing page 3 out of 3 pages
Viewing questions 21-30 out of questions