According to the PMBOK® Guide (Project Management Body of Knowledge), specifically within the Project Quality Management knowledge area and the Manage Quality or Control Quality processes:
Pareto Diagram (Option D): This is a specific type of vertical histogram used to identify the vital few sources that are responsible for causing most of a problem ' s effects. It is based on the Pareto Principle (the 80/20 rule), which suggests that 80% of problems are due to 20% of the causes. In the diagram, categories are ordered by the frequency of occurrence, helping the project team prioritize their corrective actions.
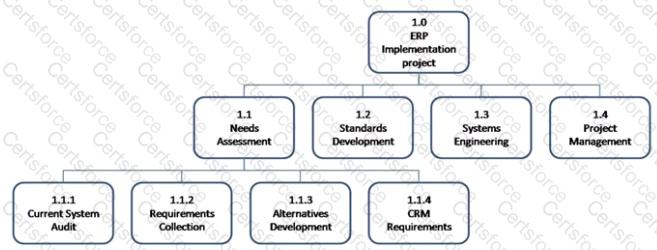
Work Breakdown Structure (Option A): This is a hierarchical decomposition of the total scope of work to be carried out by the project team. It looks like an organizational chart or an outline, not a statistical bar chart.
Context Diagram (Option B): This is a visual representation of the functional scope of a system, showing the actors (people or other systems) that interact with it. It uses boxes and arrows to show data flow.
Control Chart (Option C): This is a line graph used to determine if a process is stable or has predictable performance. It features a center line, upper control limits (UCL), and lower control limits (LCL). It does not use descending bars.
In the PMI framework, the Pareto Diagram is one of the " Seven Basic Quality Tools " and is essential for focusing resources on the most significant issues to achieve the greatest improvement in quality.
Contribute your Thoughts:
Chosen Answer:
This is a voting comment (?). You can switch to a simple comment. It is better to Upvote an existing comment if you don't have anything to add.
Submit