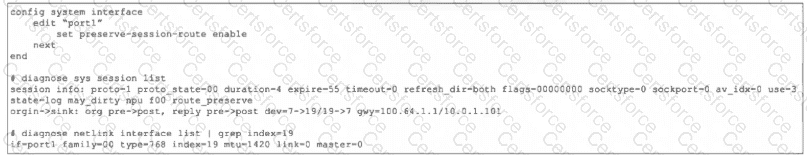
The debug output is for an HTTPS request and shows a hostname value. The study guide explains that with SSL certificate inspection, FortiGate extracts the FQDN from either:
“TLS extension server name indication (SNI)”
“SSL certificate common name (CN)”
So the hostname shown in the real-time web-filter debug can be derived from the SNI in the client request or, if needed, from the CN in the server certificate. That makes A correct.
Why the other options are wrong:
B is wrong because the study-guide example for web-filter real-time debug explicitly says: “This slide shows an example of real-time debug output when the URL to categorize isn't in the FortiGuard cache.” In these debugs, cat=255 appears before the final lookup result, so this does not indicate a local-cache hit.
C is wrong because ftgd-allow is the action , not the profile name. The debug line shows the action as action=9 (ftgd-allow) while the profile shown is profile='default' . FortiOS web-filter logs also use the profile field separately from the action field
D is wrong because the final category shown is url_cat=52 , not 255. The study guide’s example shows the same pattern: an initial cat=255 in the request line, followed by the resolved result cat=52 url_cat=52
So the verified answer is: A .
Contribute your Thoughts:
Chosen Answer:
This is a voting comment (?). You can switch to a simple comment. It is better to Upvote an existing comment if you don't have anything to add.
Submit