
Which three programming languages are supported by the AppDynamics Application Performance Monitoring solution? (Choose three.)
Where would a Performance Analyst view detailed trend graphs representing application performance from the viewpoint of the end user in AppDynamics?
What is a reason for creating an Information Point?
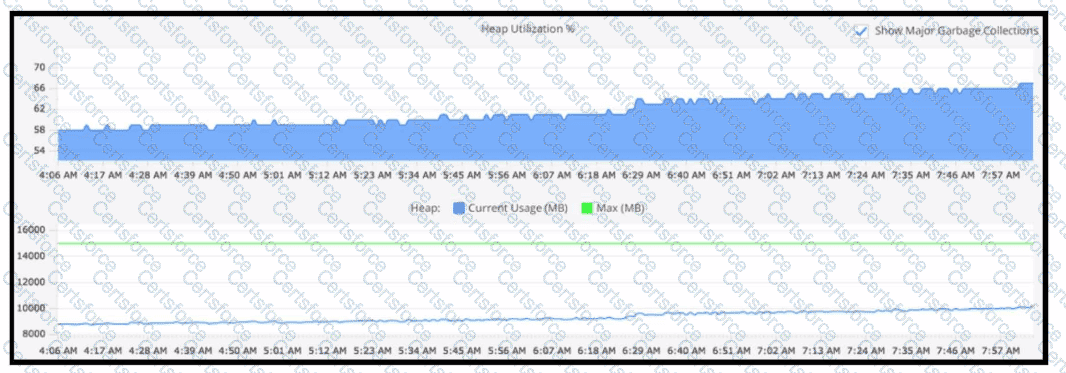
Refer to the exhibit. Using this heap utilization graph, which method is used to confirm if a memory leak is occurring during a certain time frame?

Refer to the exhibit. On which tab will the configured transaction threshold be found?
What are two options tor sharing snapshot details from the snapshot window? (Choose two.)
Which two rule types are available when creating new transaction detection rules? (Choose two.)
A Performance Analyst notices an increase in Business Transaction error rate that is much higher than normal alerts. The Performance Analyst can see these are related to the Health Rules defined for the Shopping Service that is monitored with AppDynamics Browser RUM. While troubleshooting the Performance Analyst wants details on which Browsers and Devices are affected. Which section of the Browser App Dashboard will provide this detail for a given time period?
Refer to the exhibit.
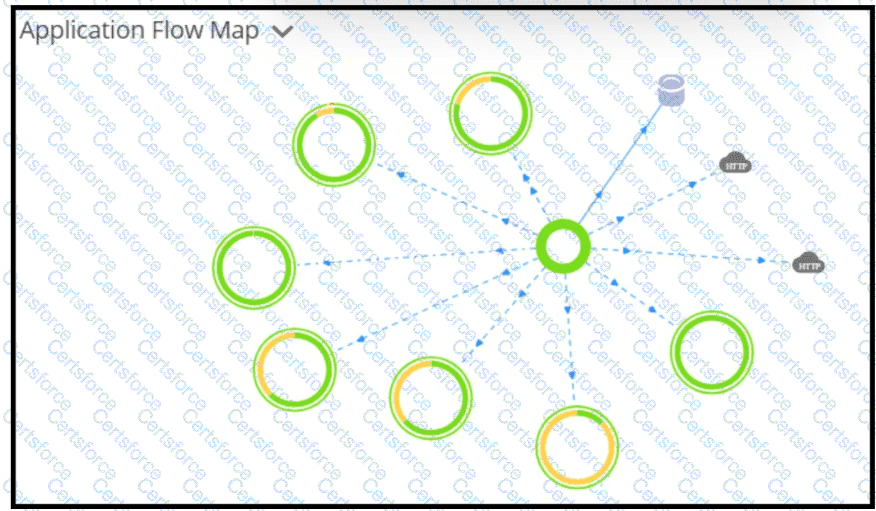
The application flow map shows several downstream applications in yellow, while the flow lines are blue and activity within the current application appears normal. Because the tier depends on these downstream applications, how could a Performance Analyst quickly evaluate the map against previous performance?
Which two things should a Performance Analyst check if an agent has failed to register with the Controller after several minutes? (Choose two.)
