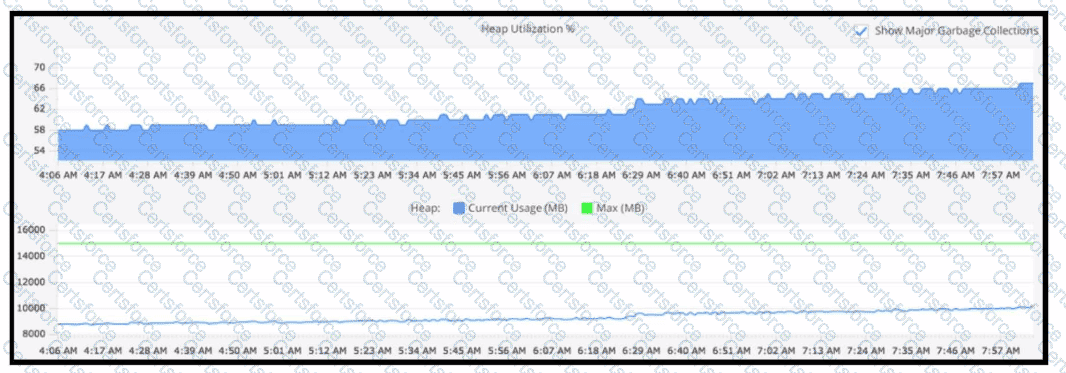
To confirm if a memory leak is occurring, one should refer to the Tiers and Nodes section of the AppDynamics Controller UI, navigate to the Memory tab, and observe the Heap Utilization over time in relation to the Heap ' s Current Usage (MB) versus the Maximum (MB) allocated. Consistent growth in heap utilization or an upward trend that does not decrement even after garbage collection indicates a potential memory leak.
[References: AppDynamics documentation on Memory Leak Detection and Heap Analysis., , , ]
Contribute your Thoughts:
Chosen Answer:
This is a voting comment (?). You can switch to a simple comment. It is better to Upvote an existing comment if you don't have anything to add.


Submit