West River Glen is deciding which network architecture should replace its old copper telephone lines. The town will replace 300 miles of Outside Plant (OSP) cable that will serve approximately 2,500 homes.
The first option is to install a Fiber to the Home (FTTH) system architecture that uses fiber-optic cable to transmit signals from the source to each home. The advantages of this architecture include greater bandwidth capabilities, less signal loss, and slightly lower new-cable deployment costs than the second option. Hybrid Fiber-Coax (HFC).
An HFC network integrates fiber-optic cables and devices with coaxial cables.
This will cost the town substantially less money for internal equipment and for customer installations. However, the coaxial cable does not last as long as fiberoptic cable and will thus need to be replaced more frequently, resulting in higher long-term maintenance expenses.
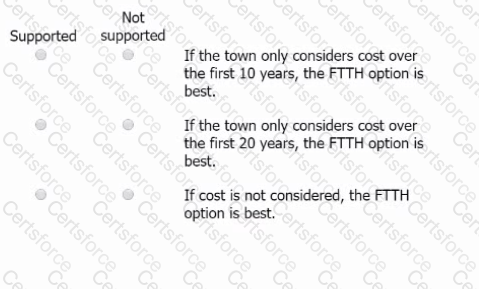
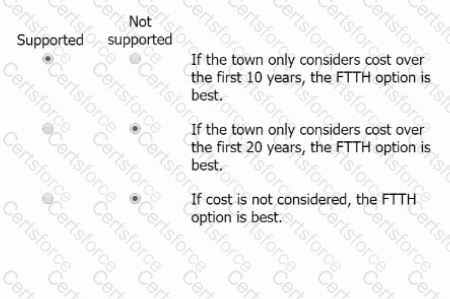
The town believes that either the FTTH or HFC architectures will be capable of serving the communities' data and television needs for the next 30 years.
For each of the following statements, select Supported'if the statement is supported by the information given. Otherwise, select Not supported.
Researchers studying long-term changes In regional mouse populations have found that by focusing on the populations of a rare but widespread and easily identifiable species of mouse (Species X), they can make fairly accurate estimations about the total regional mouse populations.
In a report on a recent study that Included the data tables that follow, the researchers provided some addenda:
1. The Species X population of Region CV increased by 123,995 between 1990 and 2005.
2. In contrast, the Species X population of Region EW declined by about 52% during that same time.
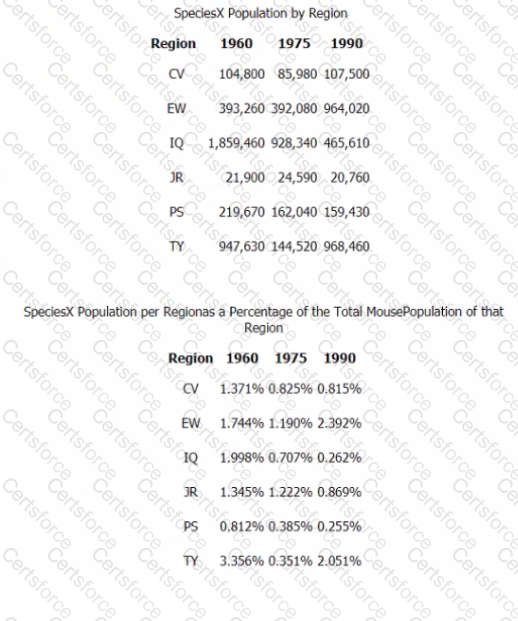
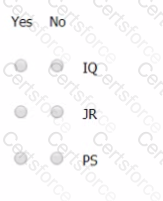
For each of the following regions, select Ye$\i the region's Species X population decreased from 1960 to 1975 AND the region's total mouse population exceeded 50 million In 1975. Otherwise, select No.
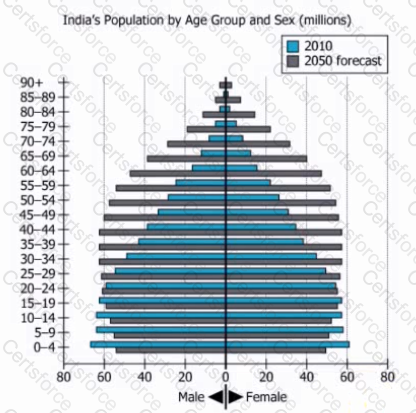
Select from each drop-down menu the option that creates the statement that most accurately reflects the information in the graph.
The age groups of India reflected on the vertical axis for which the population is projected to be higher in 2050 than it was in 2010 are the age groups that are above Select...
The age groups of India reflected on the vertical axis for which the population is projected to be lower in 2050 than it was in 2010 are the age groups that are below Select...
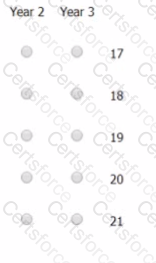
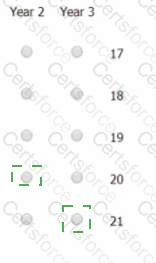
Elena has worked as a real estate agent for exactly 3 years—Years 1, 2, and 3. In Year 1, she sold exactly 16 properties. She sold more properties In Year 2 than in Year 1, and more properties In Year 3 than In Year 2. The average (arithmetic mean) number of properties she sold per year for the 3 years was 19.
Select a number for Year 2and a number for Year 3that could be the total numbers of properties Elena sold in Year 2 and in Year 3, respectively, so that the selections are Jointly consistent with the information provided. Make only two selections, one In each column.
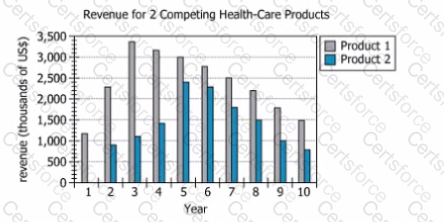
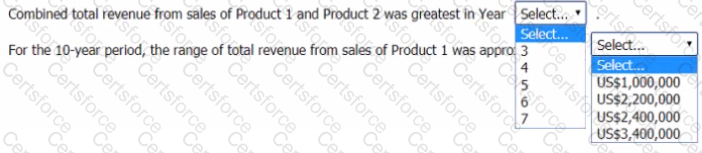
The graph shows the total annual revenue. In US dollars (US$), from sales of each of 2 competing health-care products for 10 consecutive years. Product 1 was first sold In Year 1, and Product 2 was first sold ki Year 2.
From each drop-down menu, select the option that creates the most accurate statement based on the information provided.
The color red has been shown to induce greater aggression in people than the
color blue, Researchers conducted a study to determine whether such colorinduced aggression could influence the amount that consumers were willing to
pay for an identical product in online auction and online negotiation scenarios.
The researchers photographed a single item against each of four background
colors: blue, gray, white, and red. Using a computer, each participant in the study
viewed the item against exactly one of the four background colors. Half of the
participants were told the item was up for auction and were asked to submit their
highest bid for the item. The other half of the participants were told to negotiate
a price with the seller and were asked to offer the highest amount that they
would be willing to pay for the item.
The researchers expected that participants who viewed the red background
would typically behave more aggressively than those who viewed the blue
background. Among the auction group, the researchers hypothesized that more
aggressive participants would submit higher bids as they tried to beat other
potential bidders. Among the negotiation group, the researchers hypothesized
that more aggressive participants would make lower offers as they tried to
compete against the seller to get the best deal.
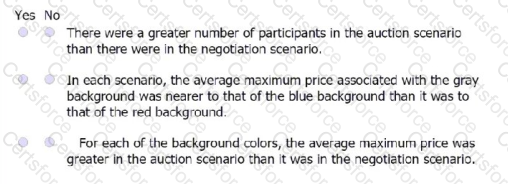
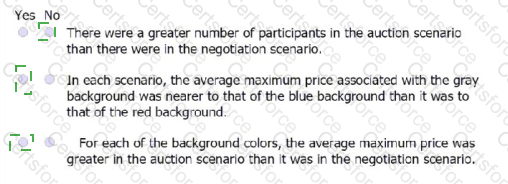
For each of the following statements about the researchers' study, select Yes if
that statement accurately reflects the information provided. Otherwise, select No.
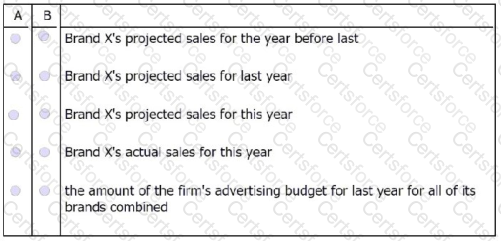
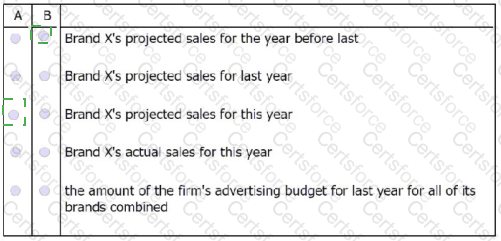
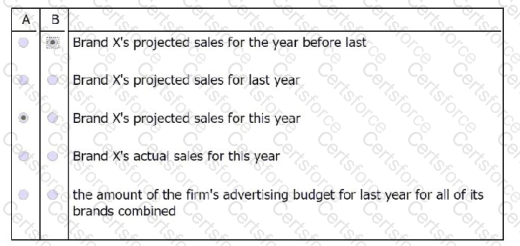
Executive: For this year, our firm's advertising budget for Brand X is four times that for last year, but only half that for the year before last. For each year, for each of our
brands, our advertising budget is 10 percent of the average (arithmetic mean) of two amounts: the brand's projected sales for the year and the brand's actual sales for the
preceding year. Actual sales of Brand X last year were $5.23 million.
Statement A: Given the executive's statements, a journalist could infer what this year's advertising budget for Brand X is if she knew what the amount of
was.
Statement B: Given the knowledge of this year's advertising budget for Brand X, if the reporter also knew Brand X's actual sales for the year before last, she could also
infer :
Select for A and for 8 two different options that, if inserted in the blanks, create statements that are supported by the statements attributed to the executive. Make only
two selections, one in each column.
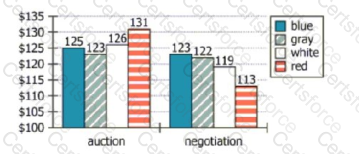
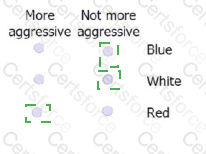
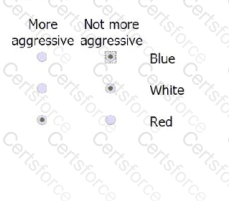
For each of the background colors, the graphic shows the average (arithmetic
mean) of the maximum prices that the participants who viewed the item with that
background reported that they were willing to pay for the item. Results are shown
for bath the auction and the negotiation scenarios.
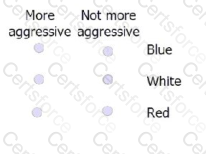
Assuming the researchers’ hypothesized link between offers and aggression is
correct, for each of the following background colors select More aggressive if, on
average, participants in the negotiation group in the study behaved more
aggressively when the product was displayed with that background color than the
participants did when the product was displayed with a gray background.
Otherwise, select Not more aggressive.
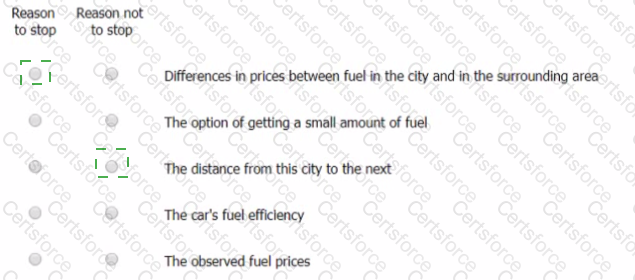
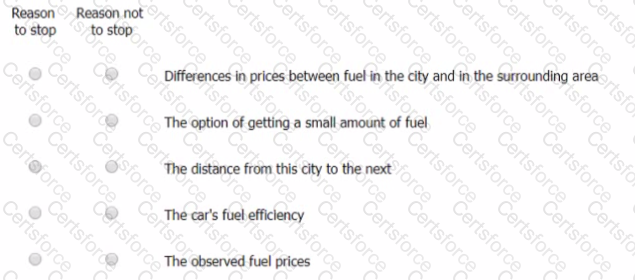
A motorist passing through an unfamiliar city needs to fill her car's fuel tank soon, well before she leaves the city, and needs to minimize her expenses. Nearby is the King Petrol station, offering the correct fuel for 2.OX) euros per liter. She has seen about one petrol station every 2 kilometers (km) of driving, on average, though distances vary. Prices at different petrol stations appear to vary randomly by up to 10%: roughly 2 km behind her in her journey she saw the correct fuel for 1.81 euros per liter. The fuel efficiency of her car under the current driving conditions is about 10 liters per 100 km. She could get a small amount of fuel at one station to allow her to drive to another station within the city.
On the basis of the information in the passage, select for Reason to stop the factor that most clearly provides a logical reason for the motorist to stop at the King Petrol station. And select for Reason not to stop the factor that most clearly provides a logical reason for the motorist not to stop at the King Petrol station. Make only two selections, one in each column.

 A picture containing chart
Description automatically generated
A picture containing chart
Description automatically generated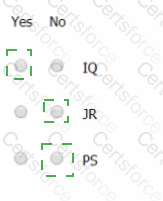


 Graphical user interface, text, application, email
Description automatically generated
Graphical user interface, text, application, email
Description automatically generated


 Chart, scatter chart
Description automatically generated
Chart, scatter chart
Description automatically generated