To customize links based on the data in your dashboard, you can automatically enter field values as _______________ in URLs
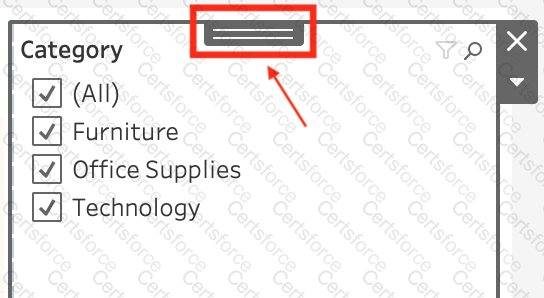
If you have a dashboard and are displaying its filter, how can you rearrange it?
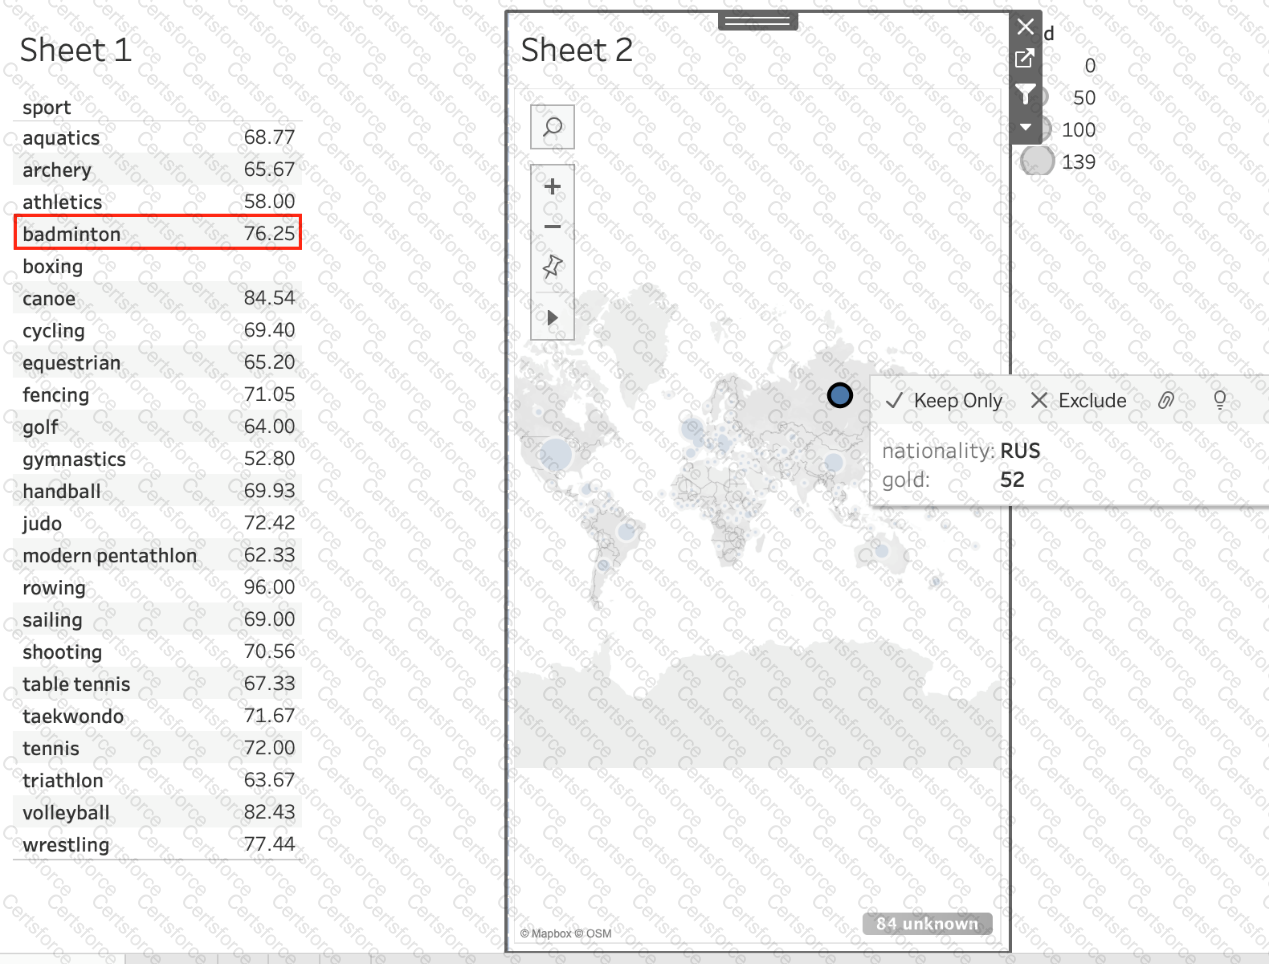
Using the atheletes table:
i) Create a sheet with a crosstab showing the Average weight for each sport (Sheet 1)
ii) Create a sheet with a Map showing the Total number of gold medals per Country. Use size as a Mark. (Sheet 2)
Now, Create a Dashboard containing both these sheets, and Use Sheet 2 as a Filter for Sheet 1. What was the average weight for Badminton in Russia?
(Ignore any nulls / unknowns)
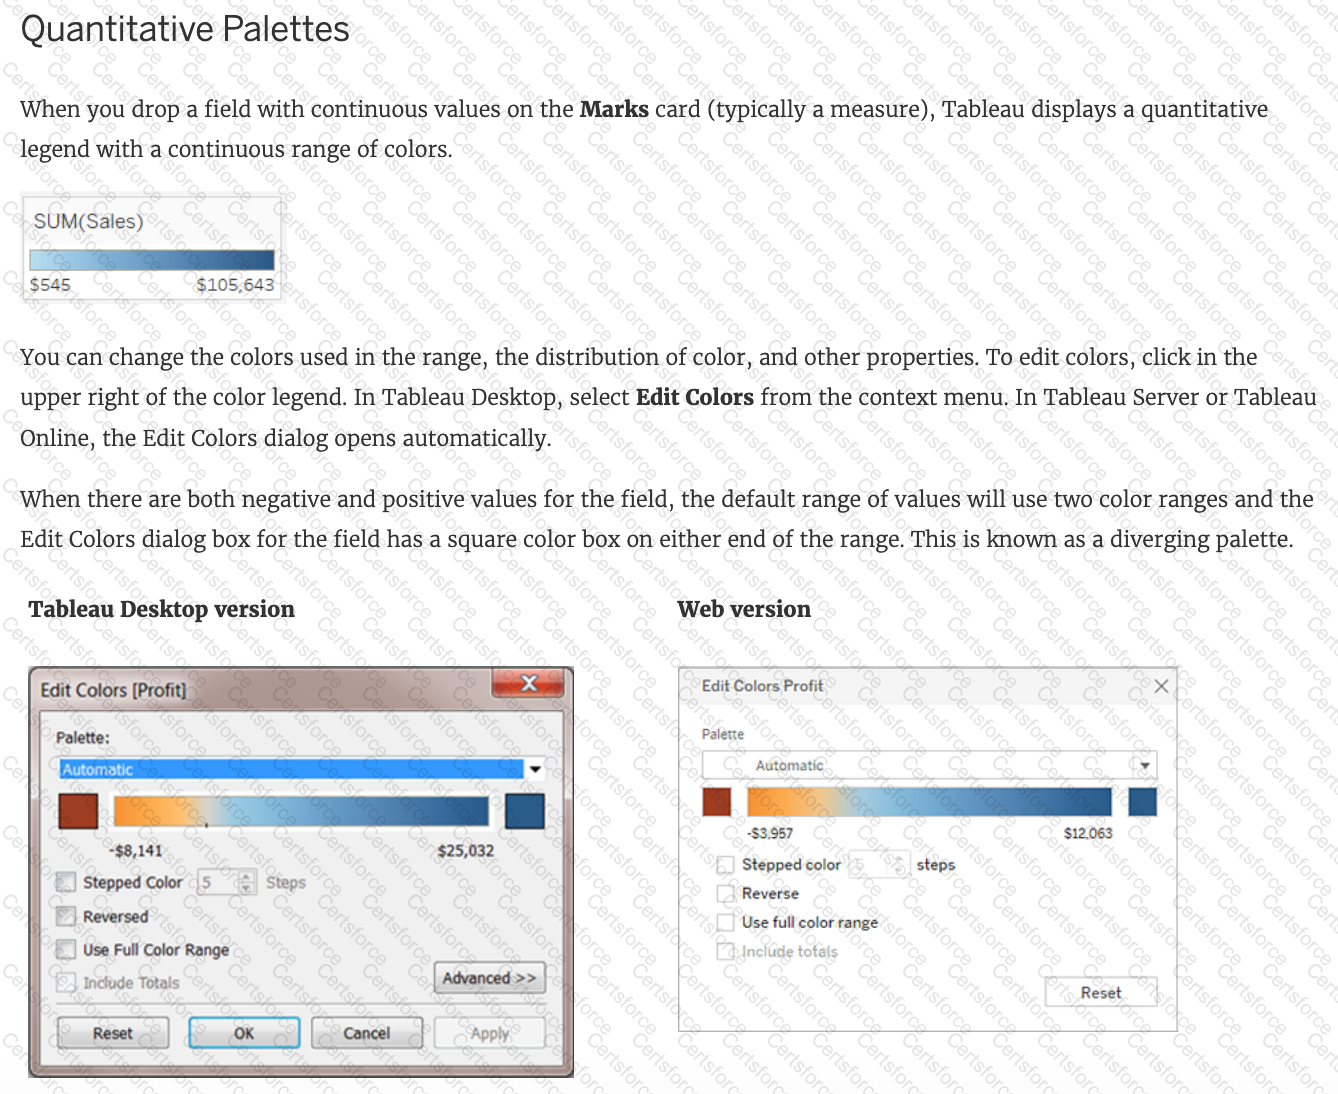
When there are both negative and positive values for a field, the default range of values will use two color ranges. This is known as a ______________ palette.
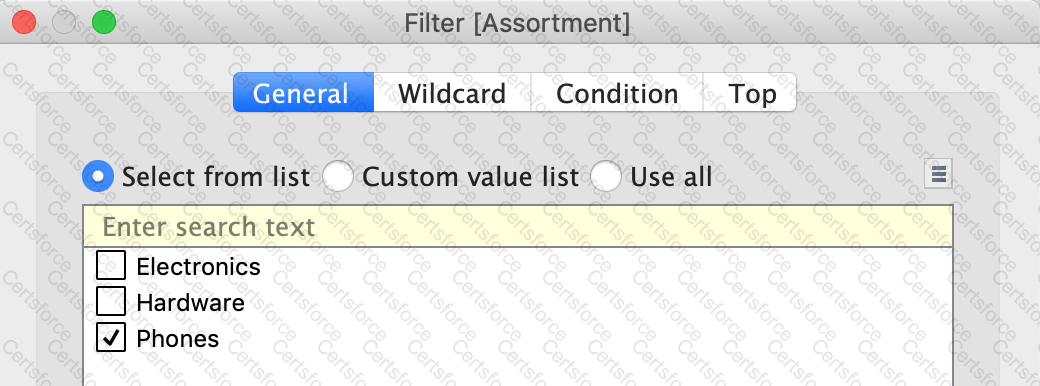
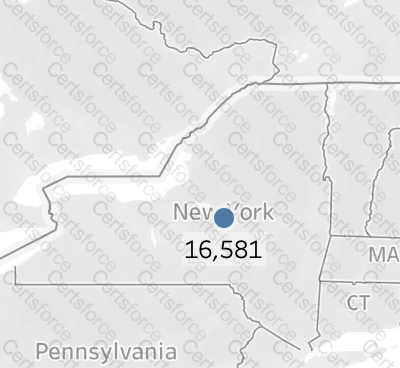
Using the Geo Data Table, create a Map showing Sales made per State. For the State of New York (NY), what was the amount in Sales ($) made for Phone Assortments with White color?
Suppose I have the following view. What will be the total number of marks if I drag a new measure to the row shelf vs the column shelf?
Which of the following are true about Dashboards in Tableau?
How can you change the default Tableau repository location?
True or False: We get different colour pallete options if we drop a discrete field on "Color" in the marks card compared to if we drop a continous field on Color.
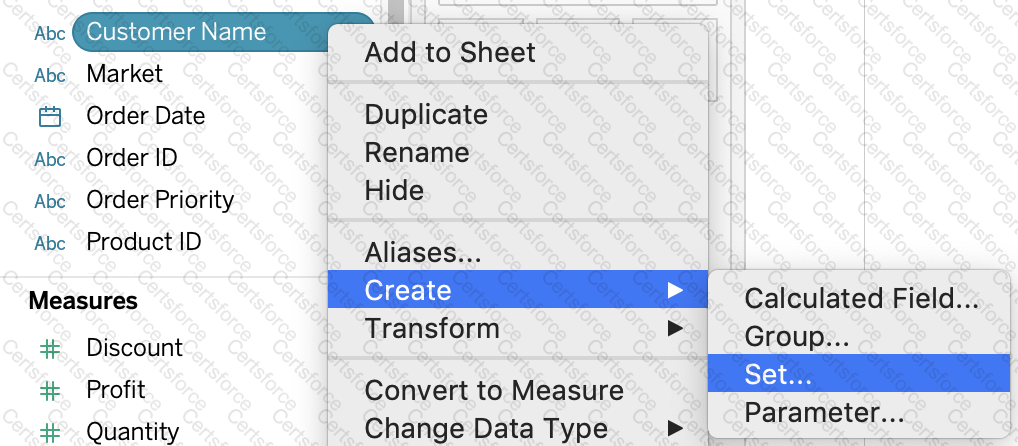
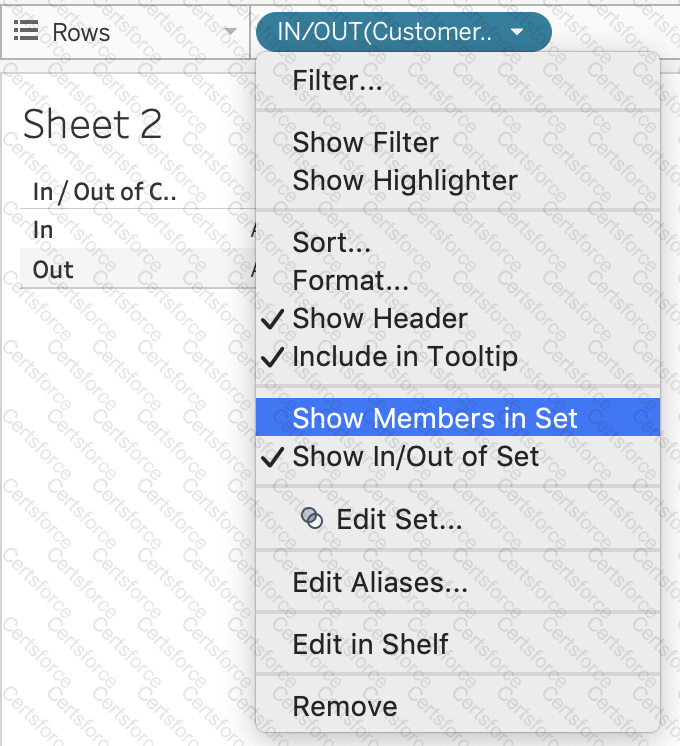
Create a Set containing Customer Names whose Sales are GREATER than 30,000. Which customer had the LEAST sales in this set?