Which function should a Data Analyst use to average sales at a less-granular level of detail than is in the view?
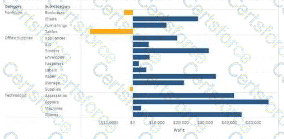
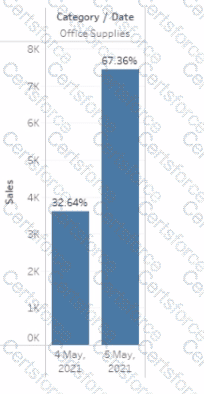
You have the following visualization.
A Data Analyst has the following worksheet, with Profit data for Categary and Sub-Categury.
The analyst executed the following calculated field at the Total level:
COUNTD( IF ( INCLUDE [Sub-Category]: SUM([Profit]) < 0 THEN [Category] END )
What is the result?
A Data Analyst has a data source that contains data for every city in the United States. The following is a sample of the data.
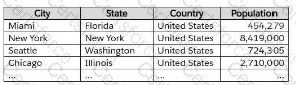
The analyst needs to use the City dimension to create a dynamic filter that shows the cities that have a population greater than 1 million.
Which type of filter should the analyst use?
A Data Analyst has the following dataset.
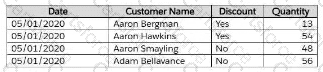
The analyst wants to create a parameter to dynamically filter the data to produce the following results based on quantity being above X value.
Which two types of parameters should the analyst use to produce the results? (Choose two)
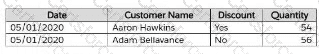
You have the following dataset
You need to create the following visualization.
Which quick table calculation should you drag to Text on the Marks card?
A Data Analyst needs to calculate the percent of regional sales that each state contributes to. As a first step, the analyst needs to calculate total sales per region.
Which calculation should the analyst use to do this?
You want to create the following table in a view.
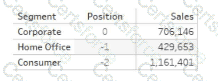
Which function should you use to create the Position column?
A colleague provides a Data Analyst with access to a folder that has the following files:
Sales.csv
Book1.json
Sales.tds
Export.mdb
Which file can contain information for connecting to an external data source, such as an SQL Server database?
A Data Analyst at a coffee company has the following visualization already built.
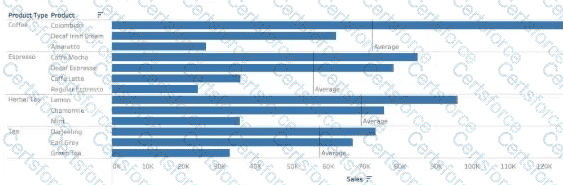
The analyst wants to make this more visually appealing by coloring the bars based on whether they are above or below the Average Sales within each Product Type.
Which calculation should the analyst use to calculate the Average Sales for each Product Type?