A Data Analyst at a coffee company has the following visualization already built.
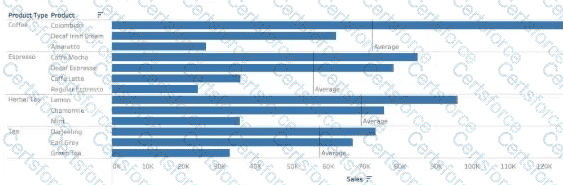
The analyst wants to make this more visually appealing by coloring the bars based on whether they are above or below the Average Sales within each Product Type.
Which calculation should the analyst use to calculate the Average Sales for each Product Type?
Submit