A client has a database that stores widget inventory by day and it is updated on a nonstandard schedule as shown below.
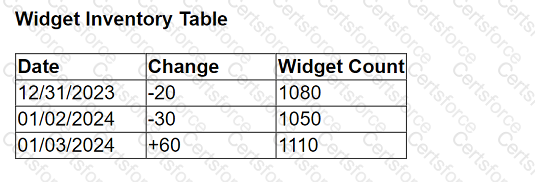
They want a data visualization that shows widget inventory daily, however their business unit does not have the ability to modify the data warehouse
structure.
What should the client do to achieve the desired result?
A client wants to see data for only the last day in a dataset and the last day is always yesterday. The date is represented with the field Ship Date.
The client is not concerned about the daily refresh results. The volume of data is so large that performance is their priority. In the future, the client will be able
to move the calculation to the underlying database, but not at this time.
The solution should offer the best performance.
Which approach should the consultant use to produce the desired results?
From the desktop, open the CCworkbook. Use the US PopulationEstimates data source.
You need to shape the data in USPopulation Estimates by using TableauDesktop. The data must be formatted asshown in the following table.
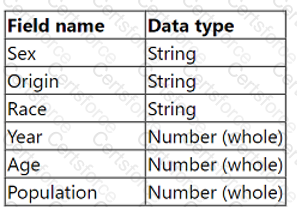
Open the Population worksheet. Enterthe total number of records contained inthe data set into the Total Recordsparameter.
From the File menu in Tableau Desktop,click Save.
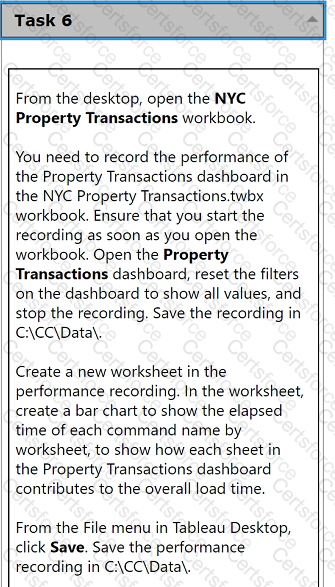
From the desktop, open the NYC
Property Transactions workbook.
You need to record the performance of
the Property Transactions dashboard in
the NYC Property Transactions.twbx
workbook. Ensure that you start the
recording as soon as you open the
workbook. Open the Property
Transactions dashboard, reset the filters
on the dashboard to show all values, and
stop the recording. Save the recording in
C:\CC\Data\.
Create a new worksheet in the
performance recording. In the worksheet,
create a bar chart to show the elapsed
time of each command name by
worksheet, to show how each sheet in
the Property Transactions dashboard
contributes to the overall load time.
From the File menu in Tableau Desktop,
click Save. Save the performance
recording in C:\CC\Data\.
From the desktop, open the CC workbook.
Open the Incremental worksheet.
You need to add a line to the chart that
shows the cumulative percentage of sales
contributed by each product to the
incremental sales.
From the File menu in Tableau Desktop, click
Save.
Use the following login credentials to sign in
to the virtual machine:
Username: Admin
Password:
The following information is for technical
support purposes only:
Lab Instance: 40201223
To access Tableau Help, you can open the
Help.pdf file on the desktop.
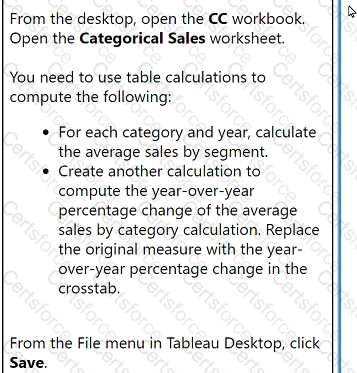
From the desktop, open the CC workbook.
Open the Categorical Sales worksheet.
You need to use table calculations to
compute the following:
. For each category and year, calculate
the average sales by segment.
. Create another calculation to
compute the year-over-year
percentage change of the average
sales by category calculation. Replace
the original measure with the year-
over-year percentage change in the
crosstab.
From the File menu in Tableau Desktop, click
Save.