A client has integrated the following files:
File A:

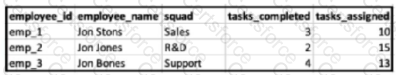
File B:
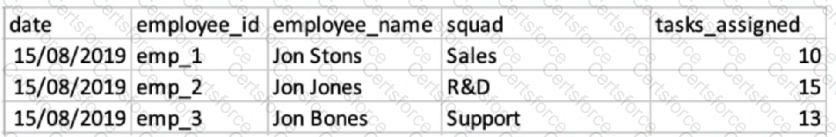
The client would like to link the two files in order to view the two KPIs (‘Tasks Completed’ and ‘Tasks Assigned) alongside ‘Employee Name’ and/or
‘Squad’.
The client set the following properties:
+ File A is set as the Parent data stream
* Both files were uploaded to a generic data stream type.
* Override Media Buy Hierarchies is checked for file A.
* The ‘Data Updates Permissions’ set for file B is ‘Update Attributes and Hierarchy’.
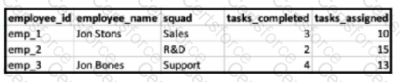
When filtering on the entire date range (1-30/8), and querying employee ID, Name and Squad with the two measurements - what will the result look like?
A)

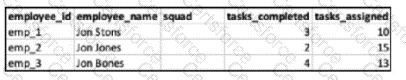
B)
C)
D)
Which two statements are correct regarding variable Dimensions in marketing Cloud intelligence’s data model?
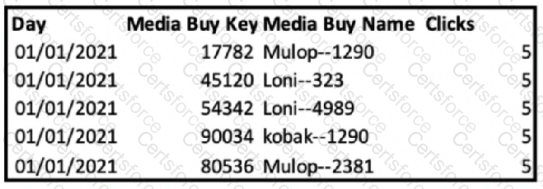
Your client provided the following sources:
Source 1:
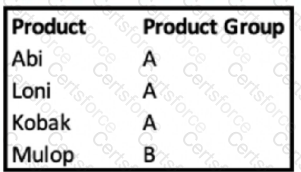
Source 2:
Source 3:
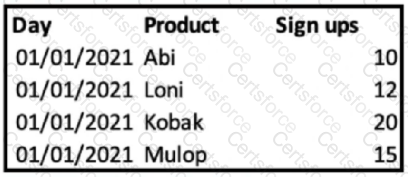
As can be seen, the Product values present in sources 2 and 3 are similar and can be linked with the first extraction from ‘Media Buy Name’ in source1
The end goal is to achieve a final view of Product Group alongside Clicks and Sign Ups, as described below:
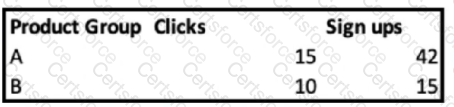
Which two options will meet the client’s requirement and enable the desired view?
A client wants to integrate their data within Marketing Cloud Intelligence to optimize their marketing Insights and cross-channel marketing activity analysis. Below are details regarding the different data sources and the number of data streams required for each source.
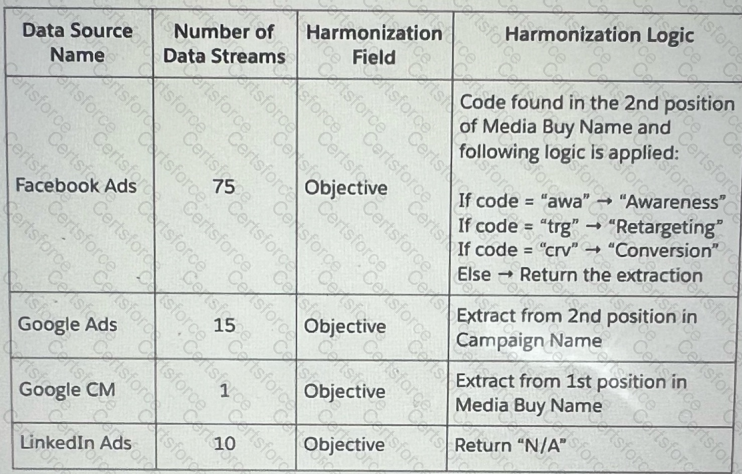
Which three advantages does a client gain from using Calculated Dimensions as the harmonization method for creating the Objective field?
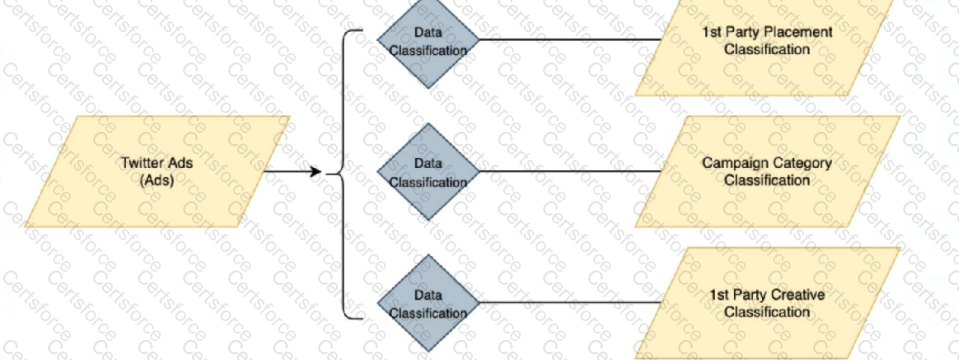
An implementation engineer has been provided with 4 different source files: 03m 48s
1. Twitter Ads ~
2. Creative Classification
3. Placement Classification
4, Campaign Category Classification
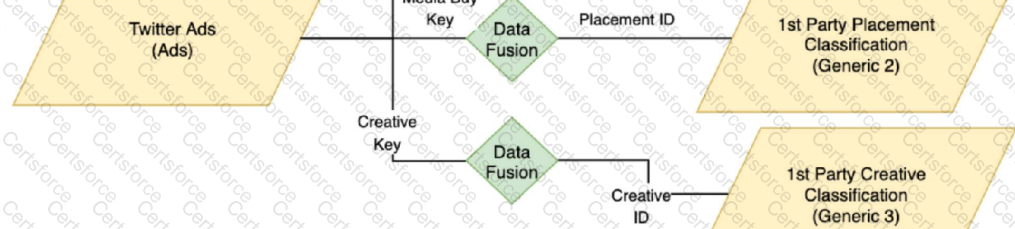
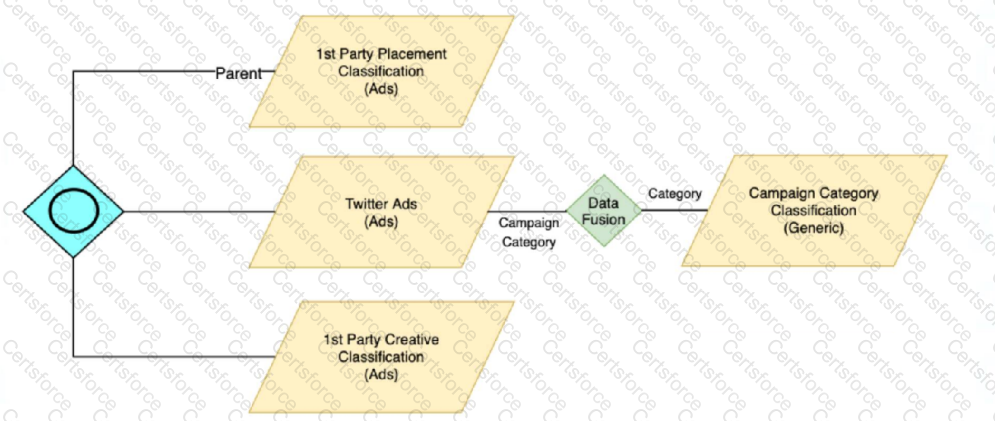
The main source is Twitter Ads (which includes various fields and KPIs), and the rest are classification files that connect to Twitter Ads and enrich different fields within it.
The connections between the files are described as follows:
1st Party Creative Classification
File structure/headers:

Creative ID — links back to Creative Key (Twitter Ads)
1st Party Placement Classification by
File structure/headers:

A)
B)

C)
D)
A technical architect is provided with the logic and Opportunity file shown below:
The opportunity status logic is as follows:
For the opportunity stages “Interest”, “Confirmed Interest” and “Registered”, the status should be “Open”.
For the opportunity stage “Closed”, the opportunity status should be closed
Otherwise, return null for the opportunity status
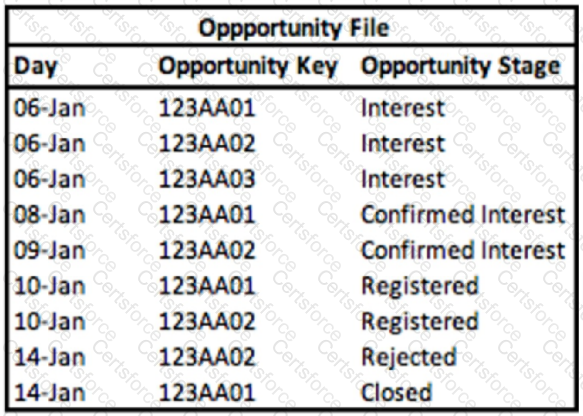
Given the above file and logic and assuming that the file is mapped in a GENERIC data stream type with the following mapping:
“Day” — Standard “Day” field
“Opportunity Key” > Main Generic Entity Key
“Opportunity Stage” — Main Generic Entity Attribute
“Opportunity Count” — Generic Custom Metric
A pivot table was created to present the count of opportunities in each stage. The pivot table is filtered on Jan 11th. What is the number of opportunities in the Interest stage?
A client's data consists of three data streams as follows:
Data Stream A:
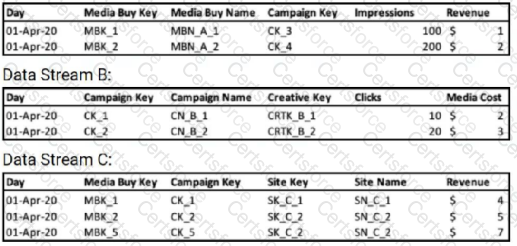
The data streams should be linked together through a parent-child relationship.
Out of the three data streams, Data Stream C is considered the source of truth for both the dimensions and measurements.
The client would like to have a "Site Revenue" measurement.
This measurement should return the highest revenue value per Site, for example:
For Site Key ‘SK_C_2’, the "Site Revenue" should be $7.00.
When aggregated by date, the "Site Revenue" measurement should return the total sum of the results of all sites.
For example:
For the date 1 Apr 2020, "Site Revenue" should be $11.00 (sum of Site Revenue for Site Keys ‘SK_C_1' ($4.00) and ‘SK_C_2’ ($7.00))
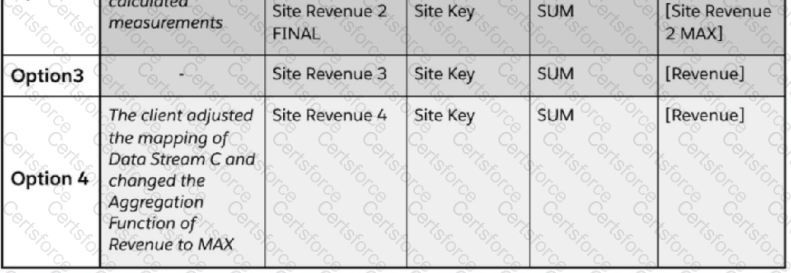
Which options will yield the desired result;
A client provides the following three files:
File A:
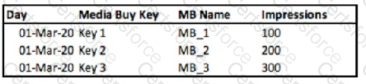
File B:
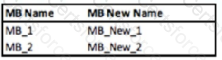
File C:
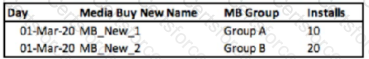
File A was uploaded using the Ads data stream type.
The client would like to create this view (data from Files B & C) in Datorama:
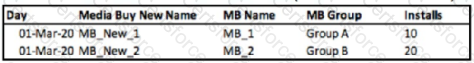
Which proposed solution would cause a false connection between the two files?