Which of these is not a primary cause for Non-normal Data?
When a Belt implements an improvement that is automated thus requiring no particular understanding for use he has applied which Lean tool?
Measurement __________ is defined as the difference between the observed and the expected values for a given set of data.
Using this data calculate the percentage of DPU.
A Belt is analyzing data and upon creation of the graphical analysis sees multiple modes. One of the primary reasons this could occur is because the process has experienced a ____________________.
When analyzing the behavior of our process to assess customer satisfaction we are concerned about both the variation such that it stays within the spec limits and how well the Mean is __________________ the process requirements.
With Measurement System Analysis we are concerned with two issues that impact the potential variability of the data. They are ____________ and Accuracy.
A Belt rearranged the location of the parts inventory for a rework station locating the most often used parts to be within hand reach of the repair person. This rearrangement resulted in quicker repair times by eliminating one of seven major elements of waste which is the Waste of __________.
Control Charts were developed by Dr. Shewhart to track data over time. To detect Special Cause variation the Control Charts use which of these?
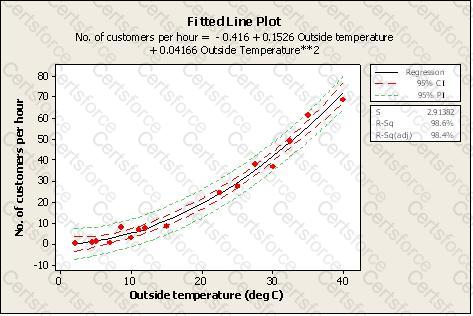
Which statement(s) are correct about the Regression shown here? (Note: There are 2 correct answers).