Pass the IASSC Lean Six Sigma Black Belt ICBB Questions and answers with CertsForce

Viewing page 2 out of 9 pages
Viewing questions 11-20 out of questions
Questions # 11:

The calculation of Column Total times Row Total divided by Grand Total yields expected values from what type of chart?

Options:

A.

Pareto Chart


B.

Sakami Table


C.

Contingency Table


D.

None


Expert Solution
Questions # 12:

A(n) ______________ is best used to compare a Machine 1 average quality characteristic to the same quality characteristic of Machine 2.

Options:

A.

1-Sample t-test


B.

2-Sample t-test


C.

F test


D.

ANOVA test


Expert Solution
Questions # 13:

If an experiment has 5 factors and no replicates for a 2-level Experimental Design with 16 experimental runs which statement(s) are correct? (Note: There are 3 correct answers).

Options:

A.

The Main Effects for the 5 factors are not aliased or confounded but the 2-way interactions are confounded with the 3-way interactions


B.

The Main Effects are confounded with only 4-way interactions


C.

The Experimental Design is half-fractional


D.

The experiment has 8 experimental runs with the first factor at the high level


E.

The experiment has only 4 experimental runs with the 5th factor at the high level


Expert Solution
Questions # 14:

To establish a sample size that will allow the proper overlap of distributions we do which of these?

Options:

A.

Multiply Alpha by 1.75


B.

Calculate one minus Beta


C.

Calculate Beta plus 2


D.

Multiply Beta by 3


Expert Solution
Questions # 15:

The method of Steepest Ascent guides you toward a target inside the original inference space.

Options:

A.

True


B.

False


Expert Solution
Questions # 16:

In a good Measurement System the most variation will be with part-to-part measurements. What should you do if the majority of variation is associated with the Gage R&R assuming the gage is technically capable?

Options:

A.

Focus on fixing the Repeatability and Reproducibility of the measurement device


B.

Purchase a new machine


C.

Focus on trimming the Part-to-Part variation


D.

Run another MSA test with the machine


Expert Solution
Questions # 17:

The relationship between a response variable and one or more independent variables is investigated and modeled by use of __________________.

Options:

A.

X-Y Matrix


B.

Baldridge Assessment


C.

Analysis of Variance (ANOVA)


D.

Critical X's Definition


Expert Solution
Questions # 18:

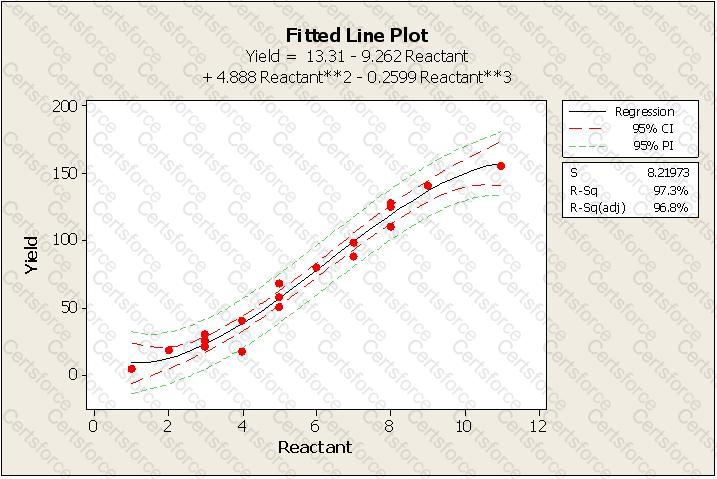
Which statement is NOT correct about the Fitted Line Plot shown here?

Question # 18

Options:

A.

The independent variable is the reactant


B.

If the reactant was 10 units, with 95% confidence we would expect a minimum yield of 148 units


C.

With at least 95% confidence, we can expect less than 10 units of Yield when the reactant is at a value of 1


D.

A reactant value between 6 and 8 units yields around 40 to 60


E.

When the reactant increases, the expected yield would increase


Expert Solution
Questions # 19:

The Mann-Whitney test is a powerful test and is unique to situations from which of the choices listed? (Note: There are 2 correct answers).

Options:

A.

Testing the identity of two populations


B.

Focuses on equality of the Median of the two populations


C.

Less powerful than the traditional “t-test”


D.

More widely applicable than the traditional “t-test”


Expert Solution
Questions # 20:

When a Belt conducts a Linear Correlation Analysis and finds that as an X increases the Y also increase then he has proven a ______________ correlation.

Options:

A.

Negative


B.

Positive


C.

Monomial


D.

Single alignment


Expert Solution
Viewing page 2 out of 9 pages
Viewing questions 11-20 out of questions