An analyst pins a dashboard from a personal folder to the team board. Other colleagues report that they cannot access the dashboard. There are a few dashboards in the personal folder that are not ready to share yet.
What should the analyst do to enable the team’s access?
An analyst needs to filter the sum of the sales between 12 complete months ago to the last 9 complete months ago.
How can the analyst create this filter condition?
A CEO wants to receive a daily email with the existing executive dashboard to review on a mobile device on the way to the office.
What should the analyst do to optimize the dashboard for mobile viewing?
The analyst is exploring weekly sales revenue in the last 3 months using a line chart. One requirement is to show the sales target $30,000 in the chart.
Which solution can help the analyst display the sales target?
An analyst needs to display data from two different sources together. There is a Look for each data source, but there is no shared field that can be combined. Both Looks are saved in the Shared folder.
How should the analyst display the data from both sources?
An analyst needs to compare monthly sales, year over year, based on when an order was created, as shown in the exhibit.
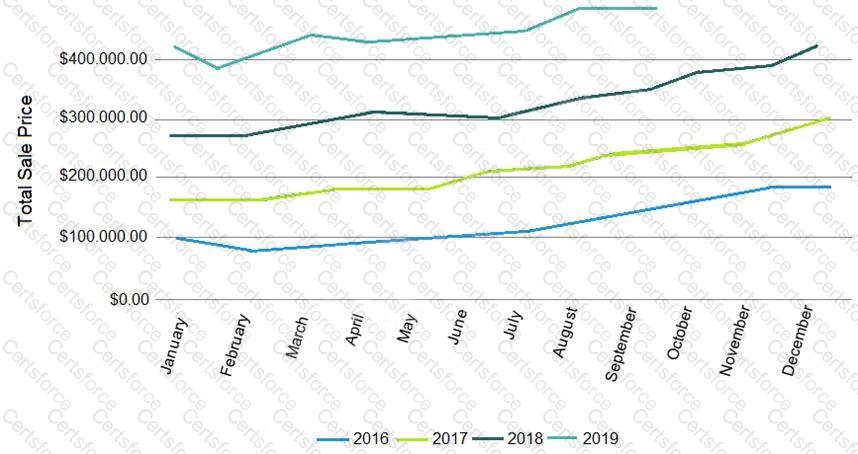
How should the analyst, in addition to selecting the measure Total Sales build the report?
An analyst adds a Day dimension and a Signup Count measure to an Explore to show the number of new users added per day. The analyst wants to add a metric that increases by the number of new users per day, on a rolling basis.
How should that metric be calculated?
An analyst works on the data team at an organization that maintains multiple similar Explores. The analyst has access to see every Explore, but knows that employees in the finance department only have access to explores tagged Finance.
There is an Employee Compensation Data Finance Explore that the finance department has access to. The analyst usually uses an All Employee Data Explore that also includes personally identifiable information.
What should the analyst do to ensure proper access if the analyst wants to send an example visualization to the finance team?
A business analyst is creating an Explore that shows the number of hotel rooms booked per week, by room type. The analyst is using a Week dimension and a Count measure, and is provisioning on a Room Type dimension. Looking at the results, the Count of King rooms seems unusually low one week.
What should the analyst do to further investigate the low numbers?
An analyst wants to schedule a dashboard in a way that makes it easier for viewing on a mobile device or for viewing a printout of the dashboard.
How can the analyst set up a schedule to accomplish this?