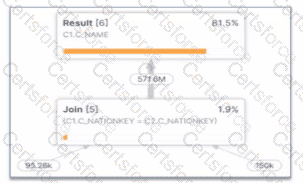
The provided image shows a specific section of a Snowflake Query Profile, which is a visual representation of the execution plan and the actual performance of a query. Analyzing this profile is a critical skill for a Data Analyst to identify performance bottlenecks.
1. Identifying the Exploding Join: The most striking evidence in this profile is the relationship between the input and output row counts of the Join [5] operator.
Input Row Counts: The join receives approximately 95.26k rows from one branch and 150k rows from the other.
Output Row Count: The join produces a staggering 571.6M rows.
When a join operation produces a significantly larger number of rows than the sum of its inputs, it is known as an exploding join (or a "Cartesian product-like" behavior). This typically occurs when the join condition is not restrictive enough or when there are many-to-many relationships with duplicate keys in both joining tables. In this specific case, joining on C1.C_NATIONKEY = C2.C_NATIONKEY has caused the row count to balloon from thousands to over half a billion.
2. Impact on Performance: Exploding joins consume excessive CPU and memory resources to process the massive intermediate result set. This often leads to secondary problems like spilling (Option A), where the data exceeds the virtual warehouse's memory and must be written to disk. However, the profile clearly identifies the join itself as the root cause.
Evaluating the Options:
Option A is a symptom, but the visual evidence of row expansion directly points to the join logic itself.
Option C (inefficient pruning) would be identified by a high percentage of partitions scanned in the Table Scan nodes, not by a row count explosion after a join.
Option D is irrelevant; while foreign keys can help the optimizer, their absence doesn't cause this specific visual profile on its own.
Option B is the 100% correct answer. The "exploded" arrow indicating 571.6M rows leaving a join fed by significantly smaller inputs is the textbook definition of an exploding join.
Submit