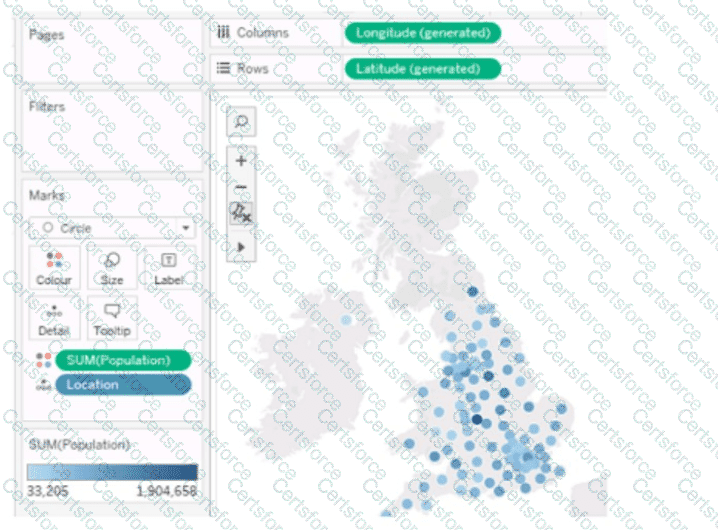
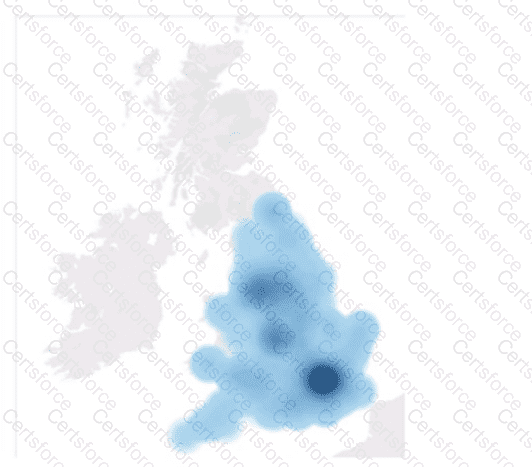
To create a map visualization that shows the concentration of data points in different locations, you need to change the mark type to Density. This will create a heatmap that uses color and size to indicate the density of the data points. You can also adjust the intensity and transparency of the density marks to suit your needs. References: The information is based on the following sources:
Create Heatmaps that Show Trends or Density in Tableau
Build a Simple Map - Tableau
Contribute your Thoughts:
Chosen Answer:
This is a voting comment (?). You can switch to a simple comment. It is better to Upvote an existing comment if you don't have anything to add.


Submit