According to the PMBOK® Guide, specifically within the Project Quality Management knowledge area, the Scatter Diagram is one of the seven basic quality tools used to analyze data.
Definition and Purpose: A scatter diagram (also known as a correlation chart) is used to explain a change in a dependent variable ($Y$) in relationship to a change observed in a corresponding independent variable ($X$). It plots pairs of numerical data, with one variable on each axis, to look for a relationship between them.
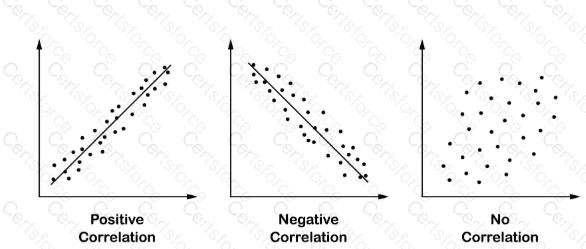
Correlation: If the variables are correlated, the points will fall along a line or curve. The better the correlation, the tighter the points will hug the line.
Positive Correlation: Both variables increase together.
Negative Correlation: One variable increases while the other decreases.
No Correlation: No apparent relationship exists between the variables.
Application: In project management, this tool is frequently used during the Manage Quality and Control Quality processes to identify the root cause of issues by seeing if a specific factor (like temperature, training hours, or pressure) is actually causing the observed defects or performance variations.
Comparison with other options:
A. Cause-and-effect diagram: Also known as a Fishbone or Ishikawa diagram. It is used to identify the various factors that might be causing a problem (root cause analysis), but it does not mathematically plot the relationship between two specific variables.
B. Histogram: A special form of a bar chart used to describe the central tendency, dispersion, and shape of a statistical distribution. it shows the frequency of occurrences but not the relationship between two different variables.
C. Control chart: Used to determine whether or not a process is stable or has predictable performance. It tracks a single variable over time against upper and lower control limits, rather than comparing two different variables against each other.
Contribute your Thoughts:
Chosen Answer:
This is a voting comment (?). You can switch to a simple comment. It is better to Upvote an existing comment if you don't have anything to add.


Submit