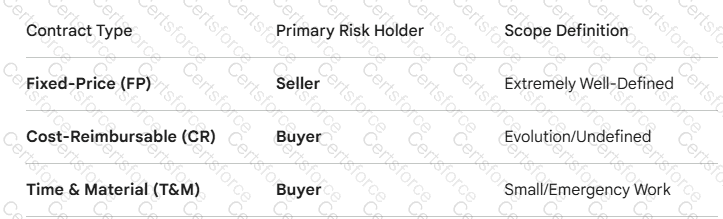
According to the PMBOK® Guide, specifically within the Plan Procurement Management process, selecting the correct contract type is essential for managing risk between the buyer and the seller. Fixed-price contracts (also known as Lump Sum contracts) place the maximum risk and legal obligation on the seller.
In a Fixed-price contract, a set price is agreed upon for a well-defined product, service, or result.
Legal Obligation: Sellers are legally obligated to complete the work as specified in the contract. If they fail to meet the project objectives or deliverables, they may be liable for financial damages or breach of contract.
Risk Allocation: The seller carries the highest risk. If the cost of performance increases (e.g., labor or material costs rise), the seller must still complete the work at the agreed price, potentially losing profit or incurring a loss.
Buyer Protection: The buyer is protected from cost overruns, provided the scope of work does not change.
A. Cost-reimbursable contracts: In these contracts, the buyer pays the seller for the actual costs incurred plus a fee (profit). The legal obligation is generally to provide " best efforts " rather than a guaranteed result. The buyer carries the financial risk of cost overruns.
B. Time and Material contracts (TandM): These are hybrid contracts often used for smaller projects or when the scope isn ' t fully defined. The seller is paid for hours worked and materials used. Like cost-reimbursable contracts, there is no absolute legal guarantee of completion within a specific budget unless a " Not-to-Exceed " clause is added.
D. Cost Plus Fixed Fee Contracts (CPFF): This is a specific type of cost-reimbursable contract. While the fee is fixed, the seller is still reimbursed for all allowable costs. If the project objectives are not met despite the seller ' s best efforts, the seller is generally not liable for financial damages regarding the total cost of the project.
Submit