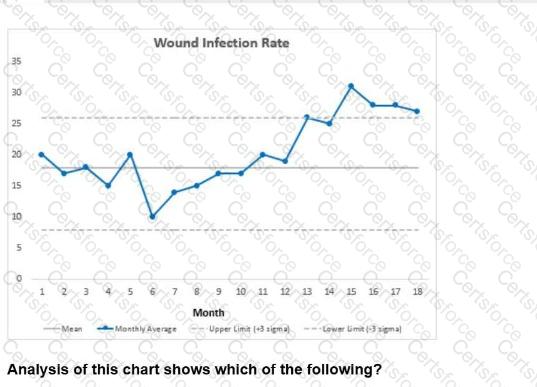
The control chart depicts wound infection rates over 18 months with a clear upward trend and several data points approaching or exceeding the upper control limit (+3 sigma). Such a pattern indicates the process is out of statistical control, meaning that the variation is not due to random chance (common causes) but rather to assignable or special causes that must be investigated (The Joint Commission, Statistical Process Control, 2024; Institute for Healthcare Improvement, Using Control Charts, 2023).
Option A is incorrect because the process is not stable or predictable; infection rates have increased significantly.
Option B is incorrect since chance events would produce variation within control limits, but here points exceed those limits.
Option C, common cause variation, implies stable, inherent system variability within control limits, which is not the case.
Option D correctly identifies that the wound infection rate is out of control and requires urgent evaluation and intervention to identify root causes and prevent further infections.
Effective quality management requires timely detection and response to such signals to improve patient safety and outcomes.
[References:, The Joint Commission, Statistical Process Control, 2024, Institute for Healthcare Improvement, Using Control Charts to Improve Quality, 2023, , , , ]
Submit