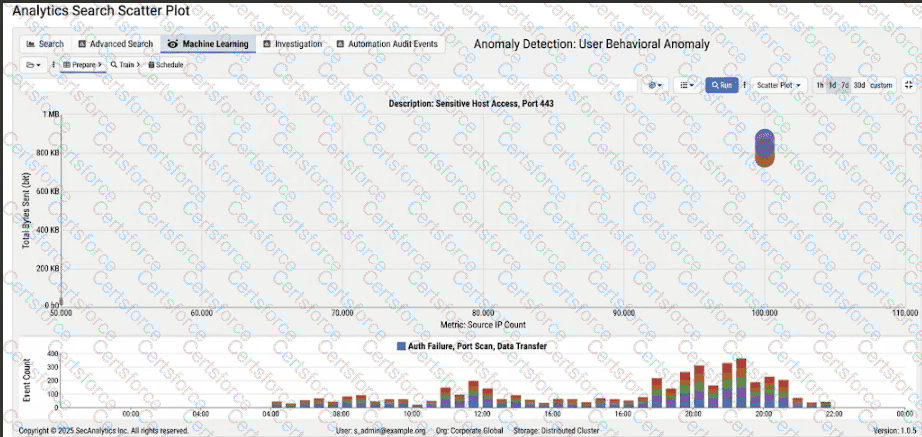
The best answer is A. Two . The exhibit shows an Analytics Search scatter plot with two visually distinct groups of data points: one isolated group around the lower-left area of the chart and another dense group near the upper-right area. For KMeans clustering, the analyst must provide the number of clusters based on the observed structure of the data. The FortiSIEM 7.4 User Guide describes KMeans as “an unsupervised clustering algorithm that groups data points into user specified K groups so that each data point belongs to one group.” It also states that KMeans “tries to iteratively minimize intra-cluster distance and maximize inter-cluster distance” and notes that the user must “specify the number of clusters based on user’s knowledge of data.”
The same FortiSIEM guide explains that during Clustering Local Mode training, the analyst chooses the algorithm and, “for KMeans choose the cluster size as a guess.” In this exhibit, the natural guess is 2, because the scatter plot separates into two obvious groups. Fifty or 100 clusters would overfit the small number of visible groups, while one cluster would merge two clearly separate behaviors into a single cluster.
Contribute your Thoughts:
Chosen Answer:
This is a voting comment (?). You can switch to a simple comment. It is better to Upvote an existing comment if you don't have anything to add.


Submit