CertNexus Certified Artificial Intelligence Practitioner (CAIP) AIP-210 Question # 11 Topic 2 Discussion

CertNexus Certified Artificial Intelligence Practitioner (CAIP) AIP-210 Question # 11 Topic 2 Discussion

AIP-210 Exam Topic 2 Question 11 Discussion:
Question #: 11
Topic #: 2

AIP-210 Question 11

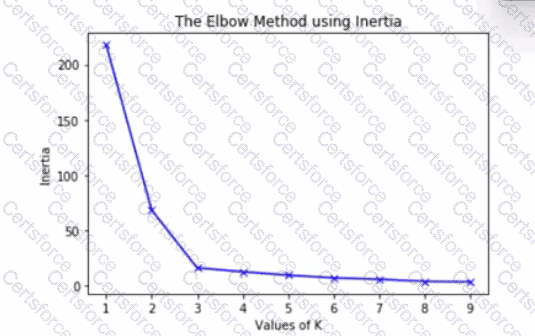
The graph is an elbow plot showing the inertia or within-cluster sum of squares on the y-axis and number of clusters (also called K) on the x-axis, denoting the change in inertia as the clusters change using k-means algorithm.

What would be an optimal value of K to ensure a good number of clusters?


A.

2


B.

3


C.

5


D.

9


Get Premium AIP-210 Questions

Contribute your Thoughts:


Chosen Answer:
This is a voting comment (?). It is better to Upvote an existing comment if you don't have anything to add.