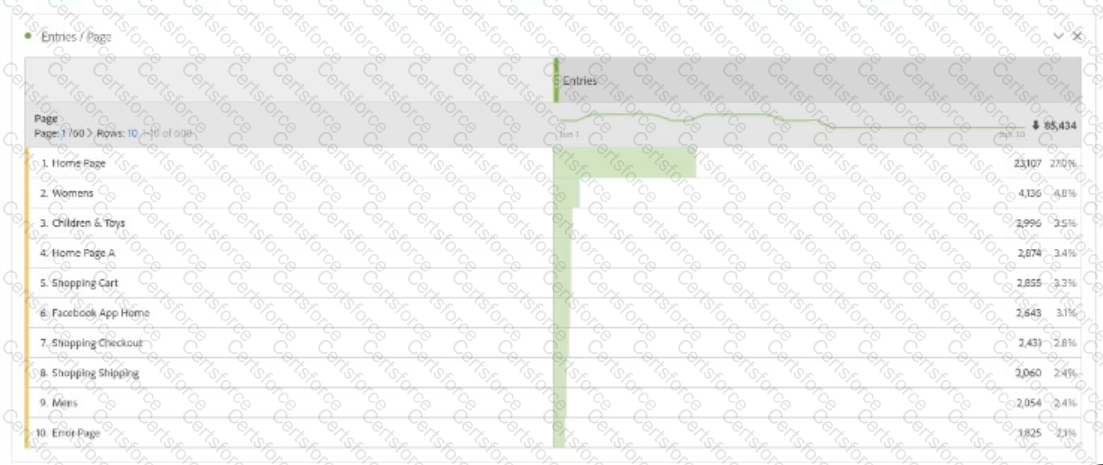
Analyzing the data in the image below, a data analyst verifies that the report of "entries" per page, shows that the "HomePage A" page is responsible for only 3.4% of the total "entries" to the site:
When comparing this information with the Occurrences per Entry Pages report below, it verifies that the "Homepage A" page has 4.5% of the total Occurrences of the Entry Pages:
Based on both the images and knowledge on the standard metrics of Adobe Analytics, which statement is correct?
What is the correct functionality when setting up Intelligent Alerts?
An analyst has been given a list of dimensions available to conduct an analysis on their hospital's doctor site.
The Solution Design Reference (SDR) contains:
eventl - Start Appointment Booking - Set on: Appointment Booking Start
event2 - Booking Complete - Set on: Appointment Booking Complete
eVarl - Doctor Type - Set on: event2
eVar2 - Number of Available Appointments - Set on eventl
propl -Appointment Pathing
Given the SDR, which report can be generated?
When creating a calculated metric, how far back does the preview show data for?
The Solution Design Reference (SDR) document states that the expiration setting for eVarl 1 is "never" and the allocation is Most Recent (Last).
What happens to the persisted value when there is a new value collected for eVar11?
A curator clicks on a tile inside a Mobile Scorecard with no dimension applied to the tile. Which Dimensions will be displayed as the breakdown Dimension?
A user without administrator rights needs to share an important segment with a group of users in a Product Profile.
How would the segment be shared?
Two single condition Segments are set up for creating a Virtual Report Suite. Both Segments are visit scoped and have the following rule using default Dimensions:
Segment A: Marketing Channel equals 'Social Networks' Segment B: Countries equals 'United Kingdom'
Which data subset of the source Report Suite will be available when using this Virtual Report Suite?
The analytics team has created an Analysis Workspace project featuring a Freeform Table and a Flow Visualization in one Panel.
Why is the scheduled report just showing the Panel Name?
A UI/UX manager asks an analyst to create an Analysis workspace visualization that shows all visits to English (/En) pages. The workspace is accessible by multiple stakeholders, most of whom have edit access.
Which visualization approach would be used?