Exhibit.

The graph summarizes the responses from 4.500 respondents who rated their degree of confidence in each of eight United States institutions. Each respondent gave each institution one of five confidence ratings: high, moderate, little, none, or undecided.
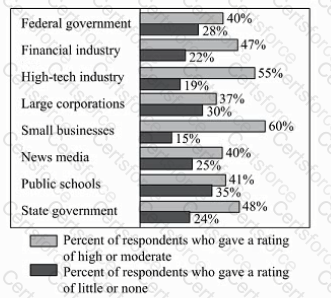
For the respondents who rated their degree of confidence in state government high or moderate, the ratio of the number who gave a rating of high to the number who gave a rating of moderate was 1 to 3. How many of the respondents rated their degree of confidence in state government high?

For how many of the five neighborhoods did the ratio of the foreign-born population to the total population of the neighborhood increase from 1930 to 1990?
In a set of polygons, 80 percent are hexagons. Of the hexagons. 20 percent are regular hexagons.
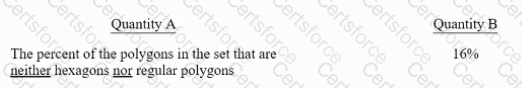
Exhibit.
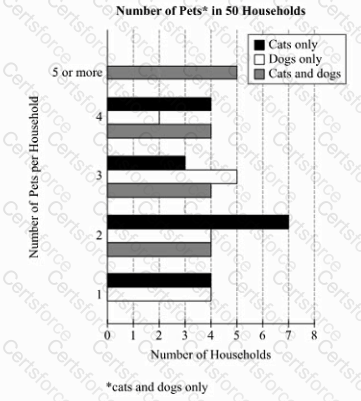
What is the total number of cats and the total number of dogs in the households with 4 pets per household if 2 households have 3 cats and 1 dog per household and 2 households have 2 cats and 2 dogs per household?
The sequence a1, a2, a3 ,,,,an is defined by 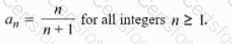

In which of the years shown was the total number of first-year students at College .V greatest?
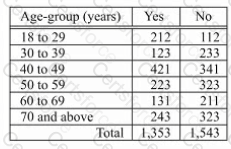
Of the 2.896 people who voted on a certain issue. the number who voted yes and the number who voted no are shown in the table. classified by age-group. Which of the following statements are true?
Indicate all such statements.